7.System Insights
System Insights provides real-time visibility into the performance of your backup and archiving environment. It is built directly into Administration UI and offers clear analytics in all key areas, helping you troubleshooting faster, use your resources more efficiently, and making informed decisions.
System Insights processes and displays information instantly, allowing you to view the most current data at any time. You can easily switch between a complete system overview and a detailed view of specific operations. The feature is built on modern technology, using TimescaleDB over PostgreSQL for maximum performance and real-time analysis, while also supporting SQL Server 2022 and later to ensure flexible deployment options.
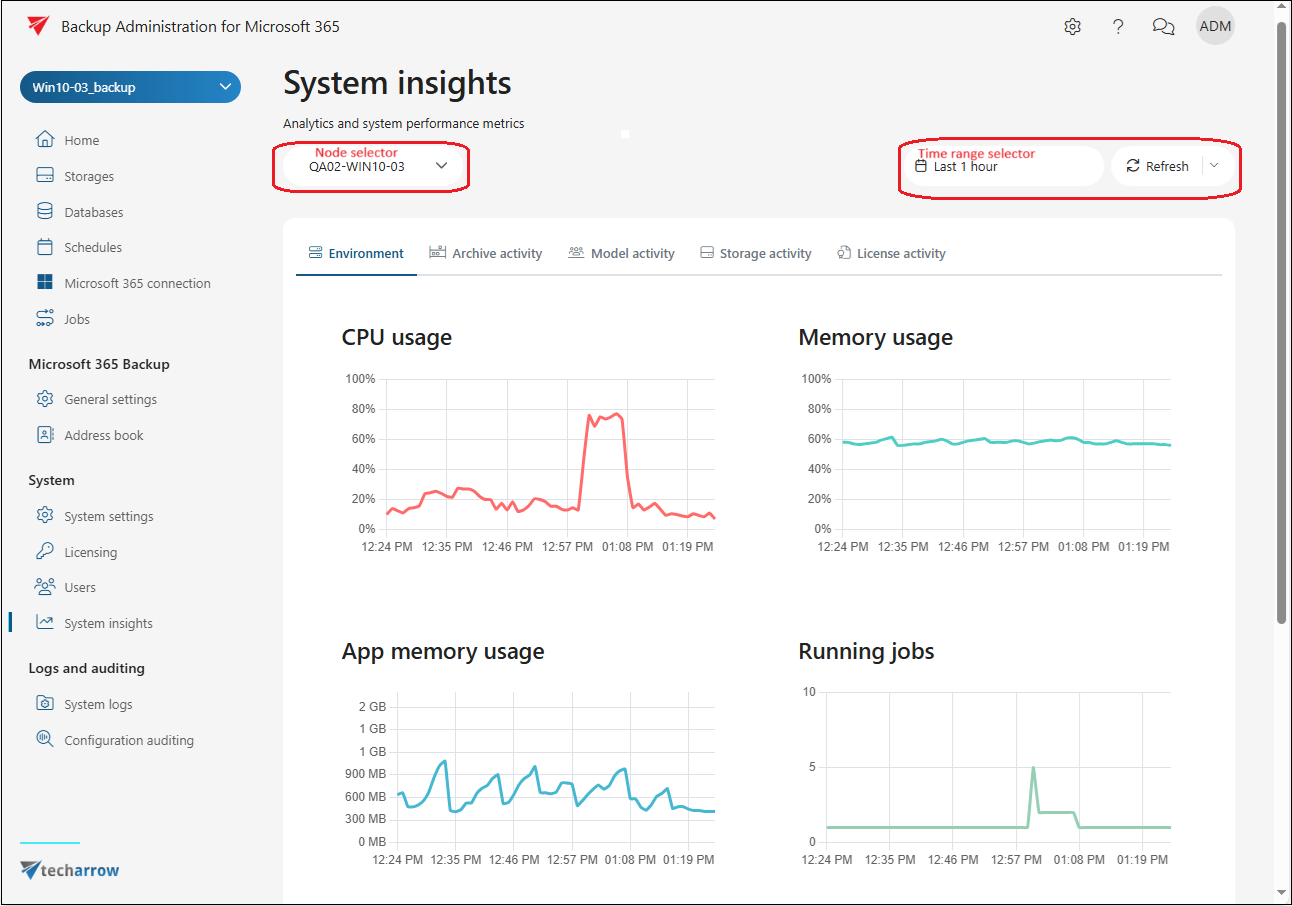
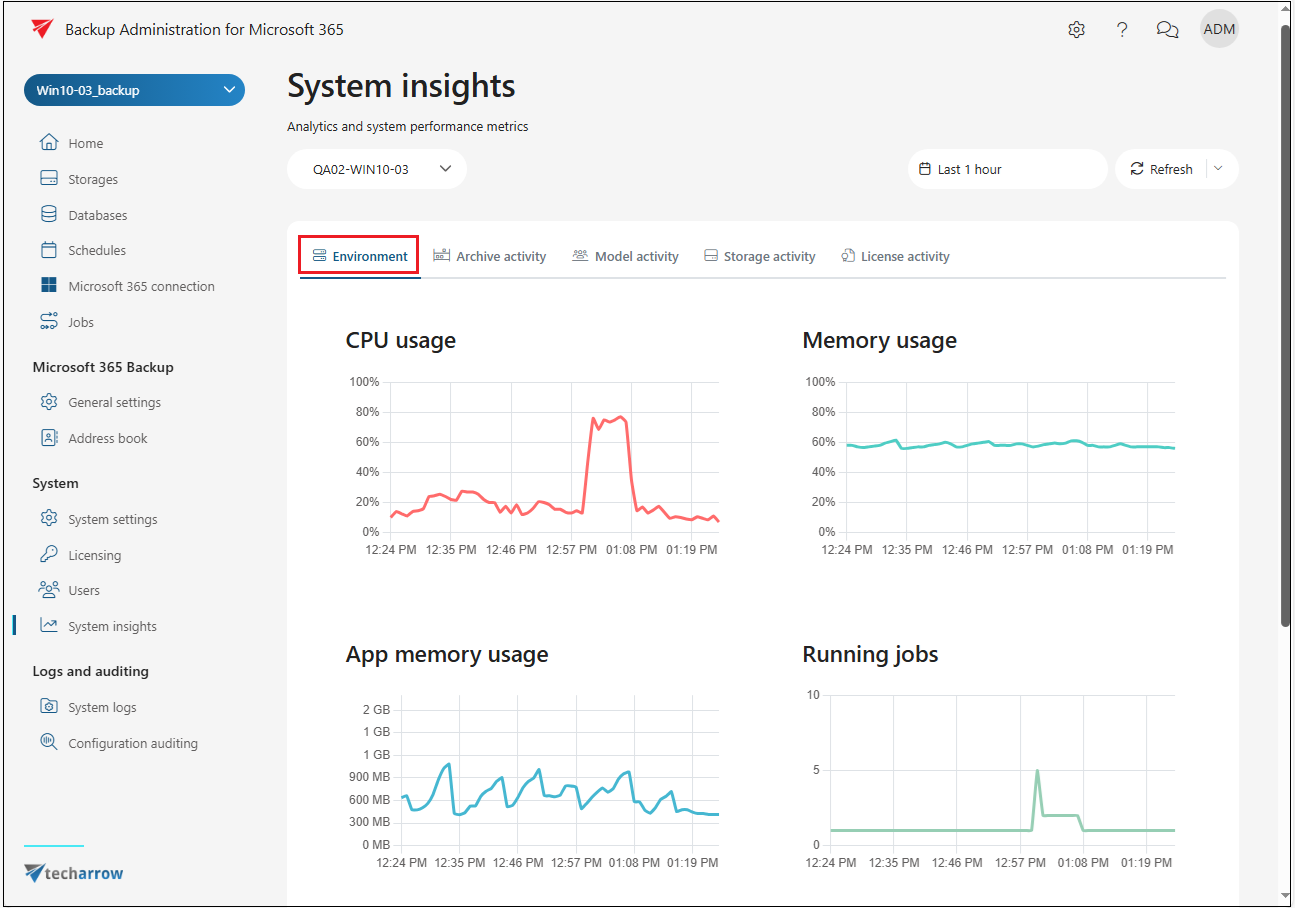
Through System Insights, you can monitor live metrics such as CPU usage, memory consumption, application memory usage and the number of running jobs, while allowing for proactive workload management.
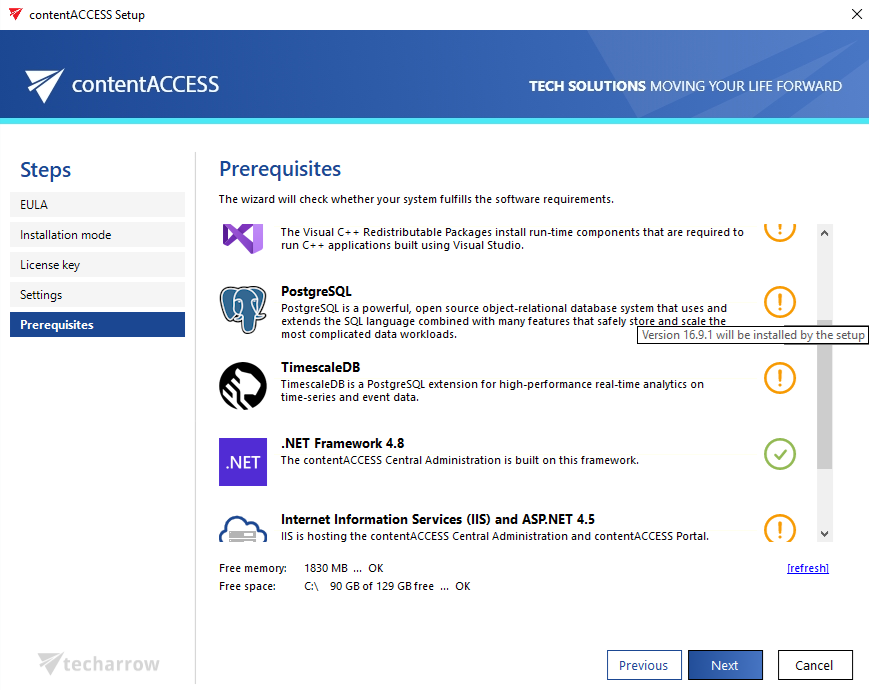
System Insights is compatible with both MSSQL and PostgreSQL databases, although PostgreSQL is recommended because the TimescaleDB extension is ideally suited for this type of workload. If selected during first installation, contentACCESS automatically installs PostgreSQL and creates the required database.
However, it is not possible to switch from MSSQL to PostgreSQL during an update; PostgreSQL can only be used if the system was originally installed with it or if a first installation is performed.
The feature is available starting from contentACCESS version 7.1. To use it, the SQL server version must be 2022 or later, and PostgreSQL must be version 16.9.1 or newer.

If these requirements are met, the installation package will automatically deploy System Insights. If an older version of PostgreSQL is detected, the installer will update it automatically.
Key Features:
1. The Environment tab shows CPU usage, memory usage, application memory usage, active users, and running jobs, providing real-time insights into overall system performance and resource consumption.
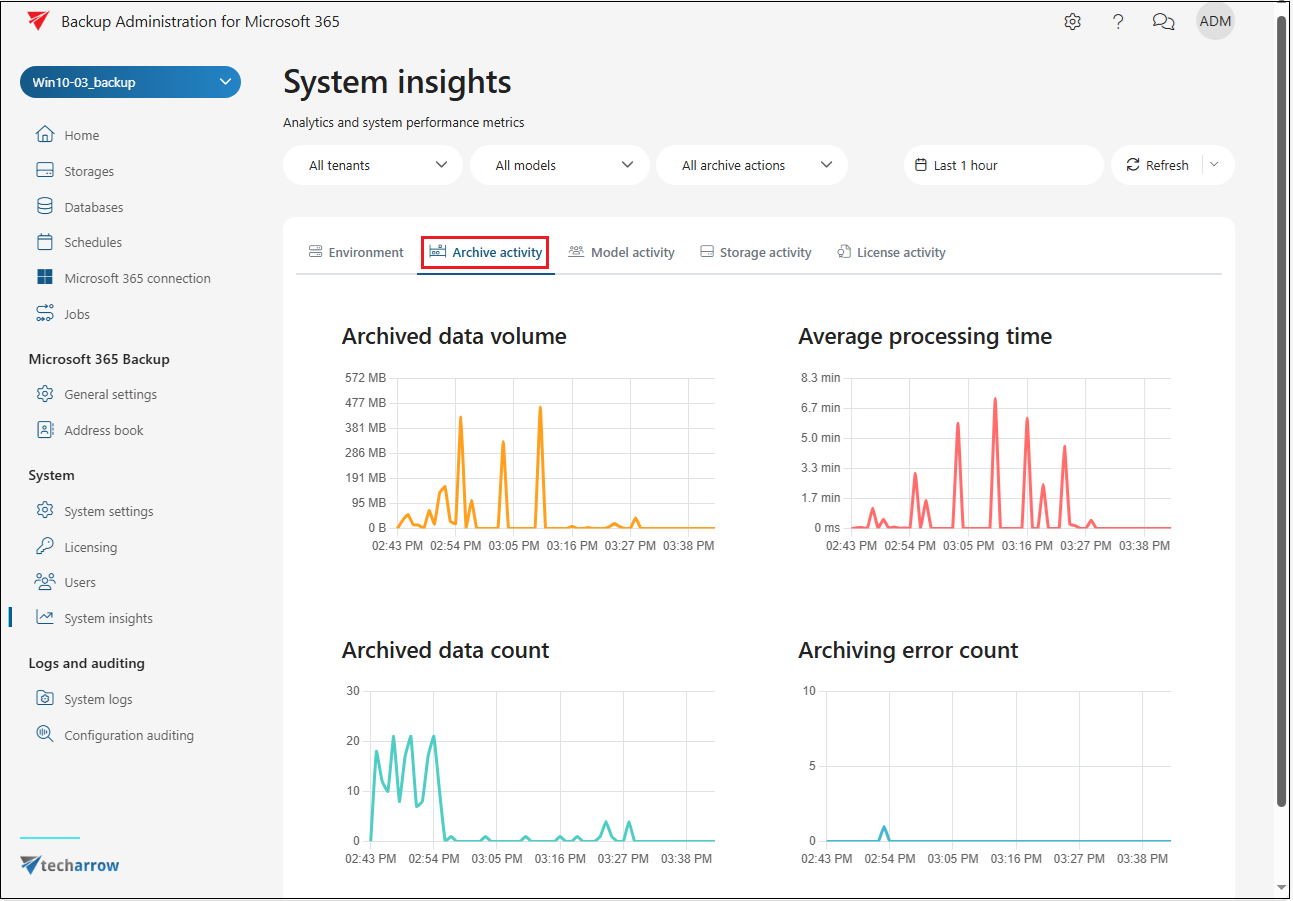
2. Archive activity can be tracked in detail, including the total volume of processed data, the number of archived or backed up items, average processing time, and error occurrences, making it easy to identify any factors affecting performance.
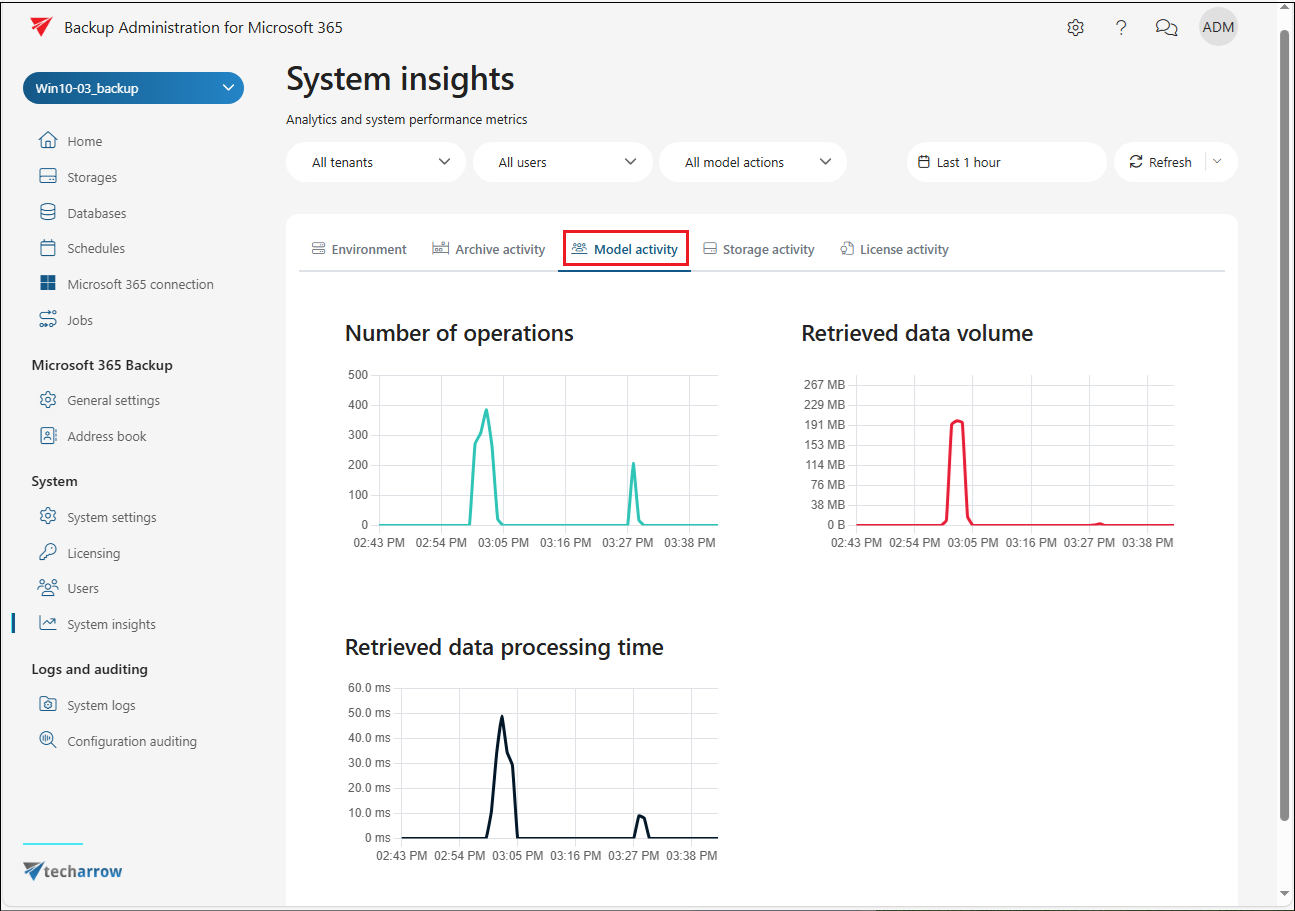
3. Model activity analytics display the number of operations performed, the total amount of data retrieved, and the average retrieval times, enabling precise performance tuning.
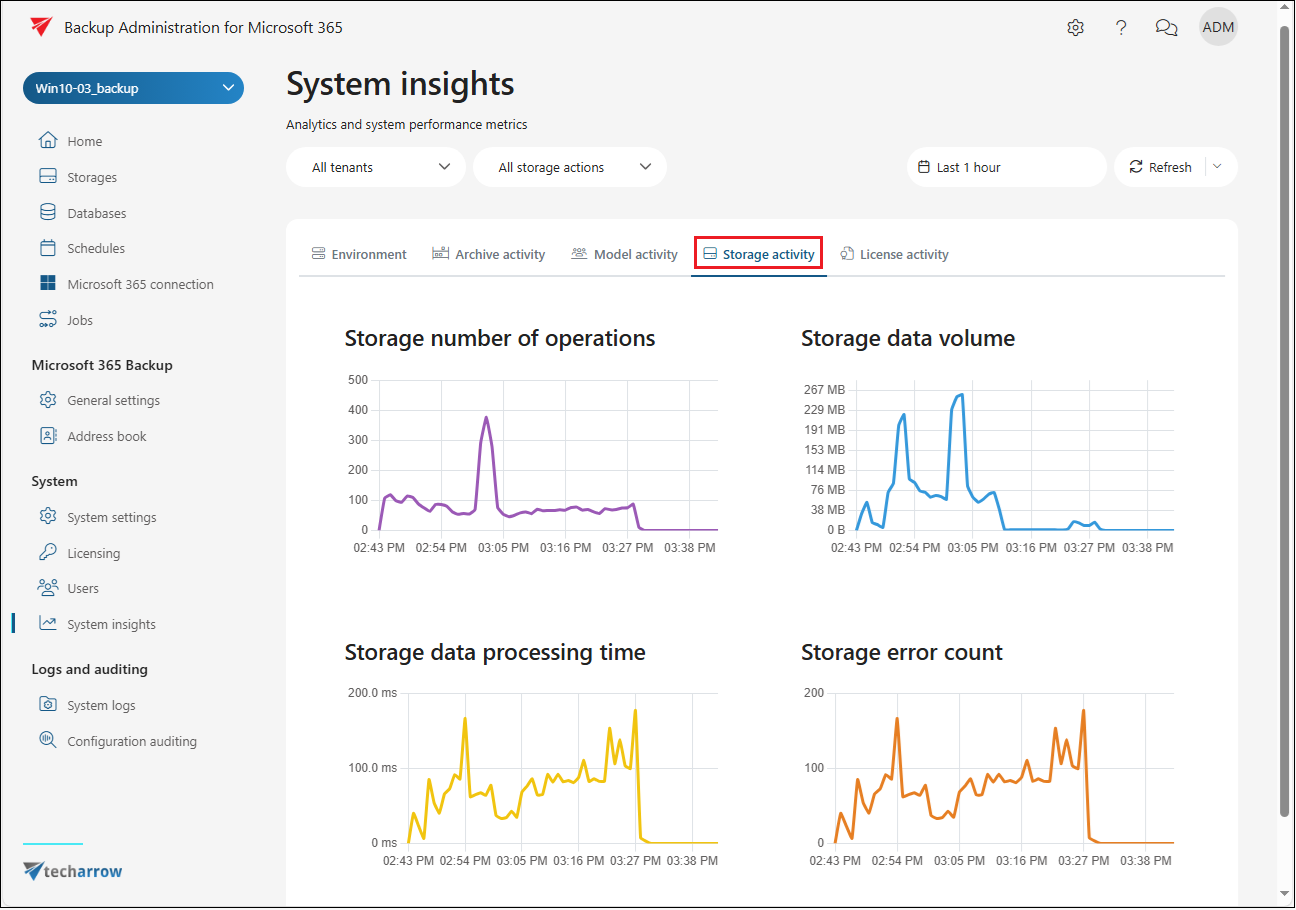
4. Storage activity tracking gives you information about the number of storage operations, the data volume handled, processing times, and any failures, ensuring that your storage runs smoothly.
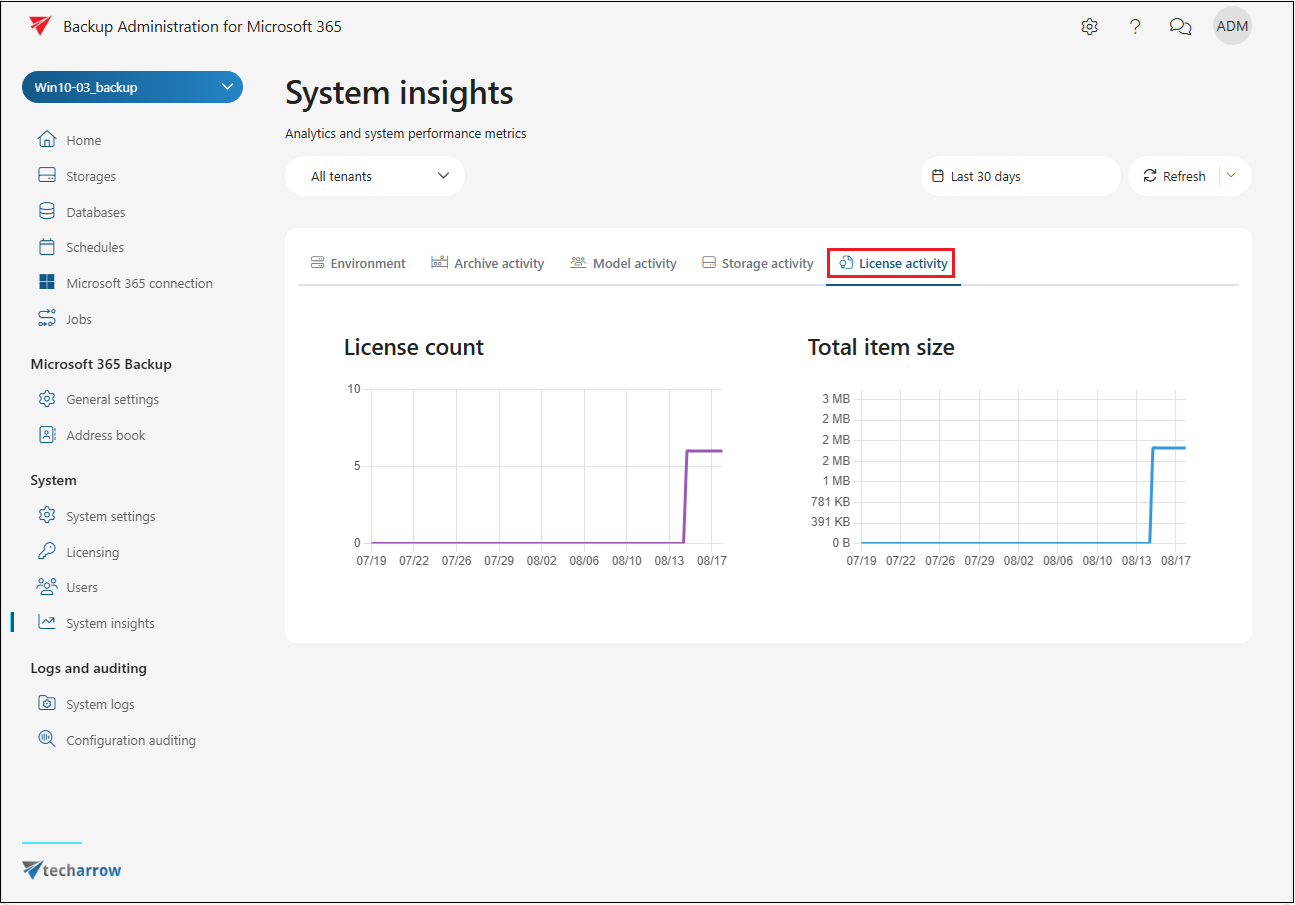
5. License usage insights provide a clear overview of the total data volume used and the number of licenses in use, supporting both capacity planning and compliance monitoring.
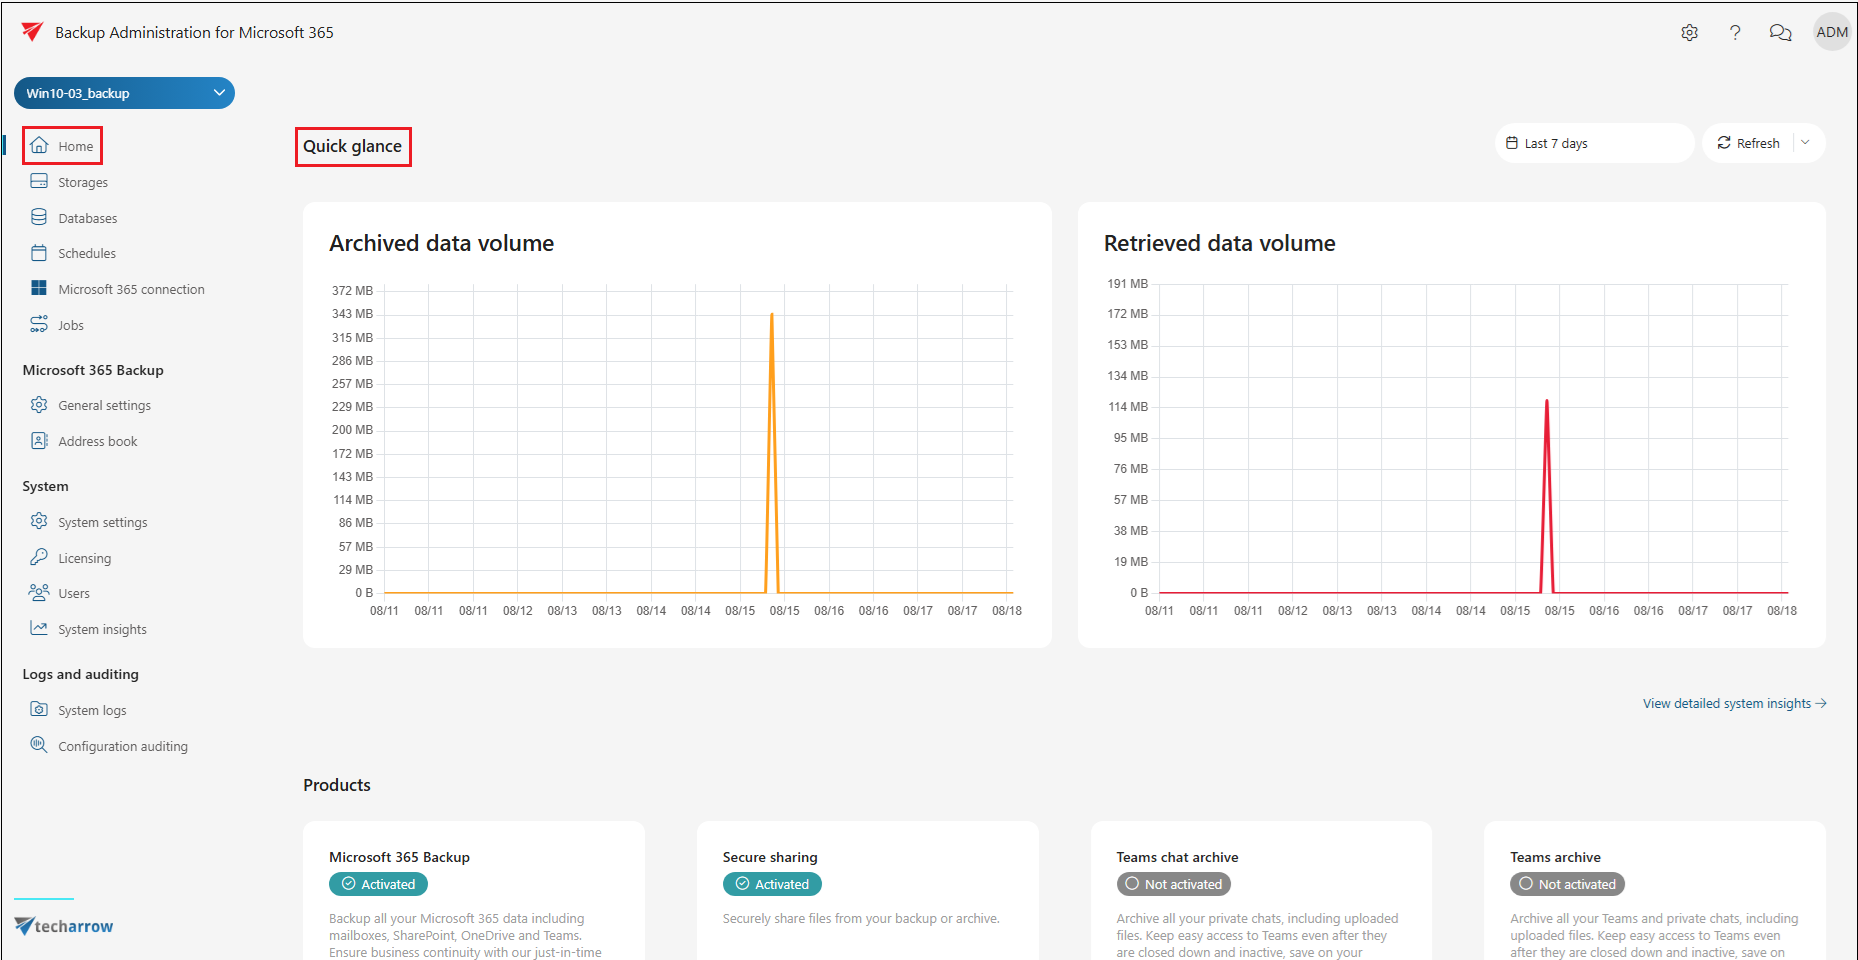
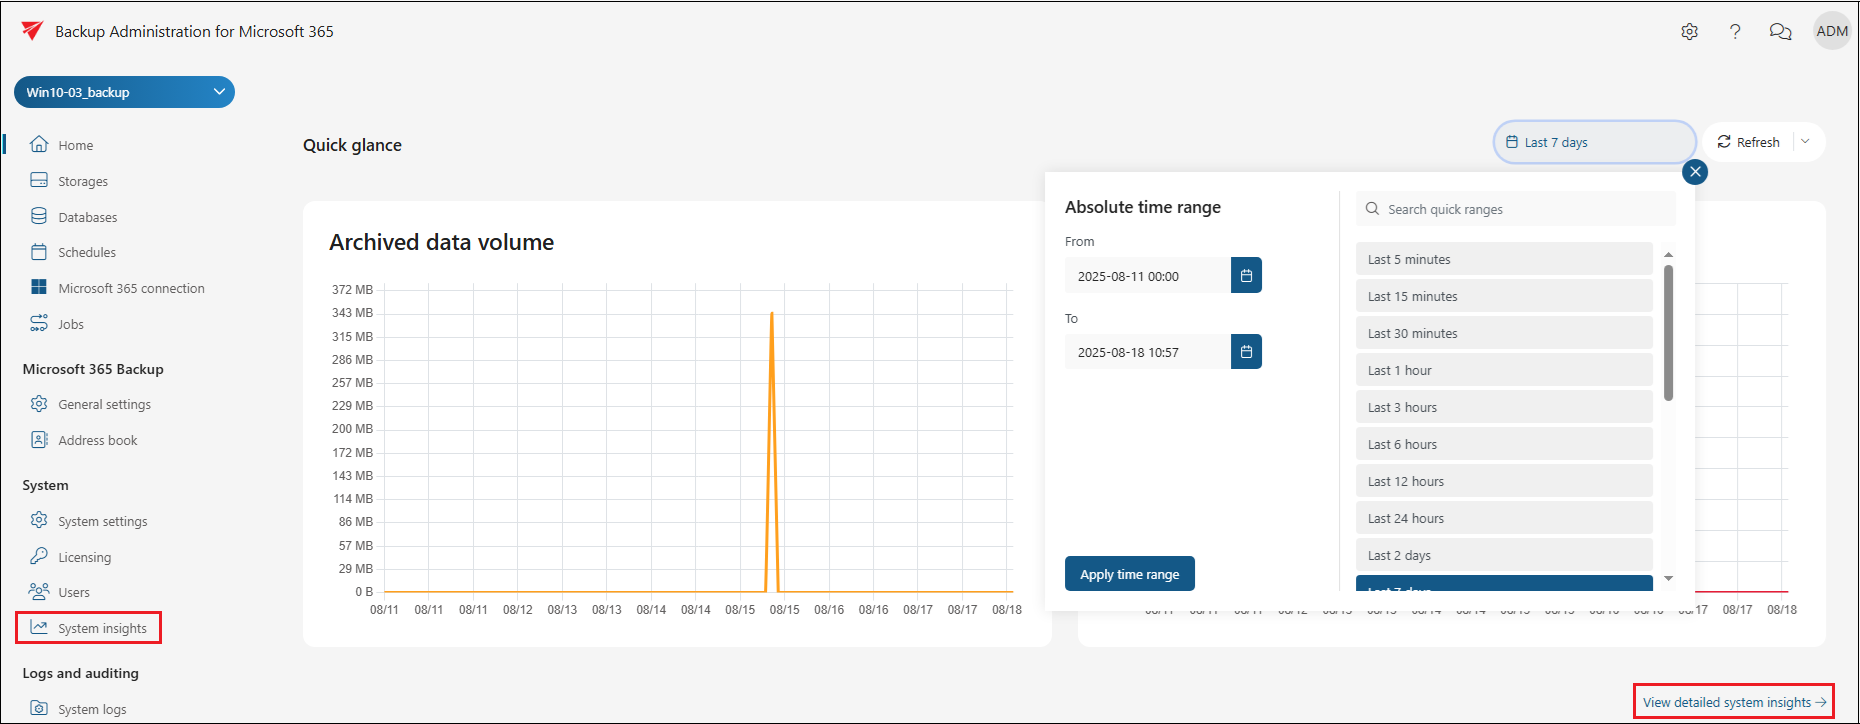
When System Insights is available, the Home page of the Backup Administration displays a Quick glance panel that shows analytics for archived, backed up or retrieved data volumes from the last 24 hours.
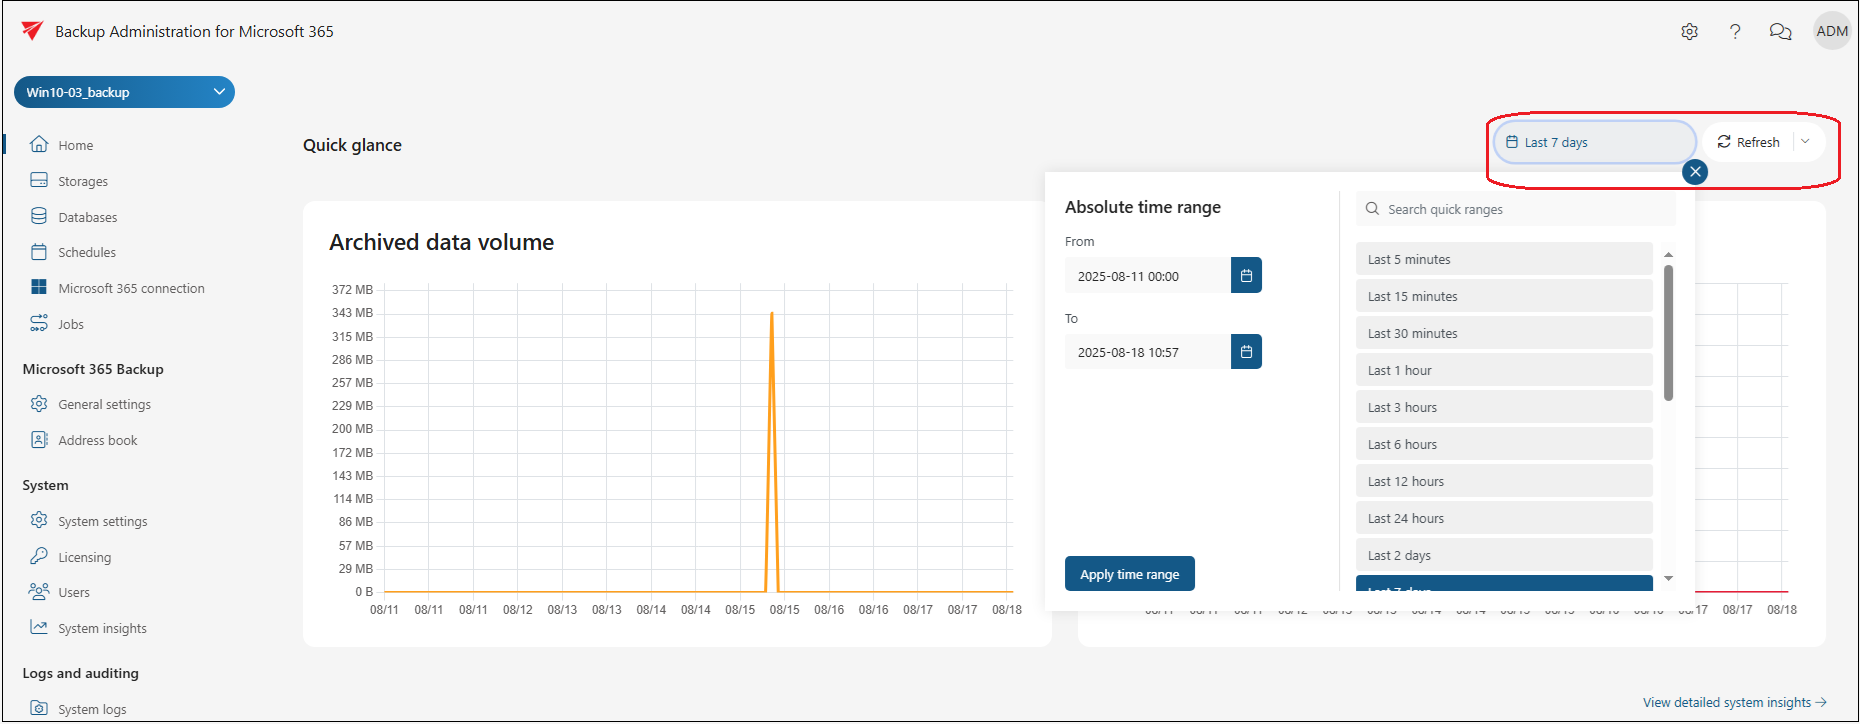
The time range can be adjusted through the Absolute time range window, and the displayed data can be refreshed manually with the Refresh button or set to update automatically at regular intervals.
The detailed System Insights page can be accessed either by clicking the View detailed system insights button on the Home page or by selecting the corresponding option in the left-hand menu.
On the System Insights page, analytics and system performance metrics are presented in a clear and organized way. By default, data for the current node is shown, but other nodes can be selected through the node selector. The time range can also be adjusted, and the data can be refreshed at any time.
The analytics and system performance metrics are grouped into five main categories.
1. The Environment section shows CPU usage, memory usage, application memory usage, active users, and running jobs.
2. Archive activity provides metrics on archived or backed up data volume, average processing times, archived item counts, and archiving or backup errors.
3. Model activity contains data on the number of operations, retrieved data volumes, and retrieval processing items.
4. Storage activity reports the number of storage operations, total data volume handled, processing times, and any storage errors.
5. License activity displays the number of licenses in use and the total item size, ensuring that licensing remains transparent and easy to monitor.
In conclusion, System Insights brings together real-time monitoring, detailed analytics, an an intuitive interface to give administrators complete control over their backup and archiving environment. By delivering instant visibility into different areas, it ensures that performance remains optimized, resources are used efficiently, and systems are prepared to meet both current demands and future growth.

