6.10.System logs — how to find out possible misconfigurations / reasons of potential system/job failures
Navigate to System ⇒ Logs and auditing ⇒  System logs button.

The System logs feature enables to check the currently running or in the past run system or job related events very easily. The user can check here all desired system events such as system updates, shutdowns, startups, system component updates, or possible system errors etc. In System logs feature, the user also has the chance to check all possible failure details that might happen during the running of the jobs, so it makes the troubleshooting easier.
If you first open System logs, you can see the following basic parts on the interface: Runs of the jobs or system on the left side (red frame); system and job events on the right side (green frame). With clicking on the Refresh button (purple arrow) you can also check the real-time running jobs. With this button it is possible to reload the current runs/event from the database. With a single click on the collapse all/expand all buttons (indicated with blue arrows) you can expand or collapse all sessions for all jobs. It is also enabled to list among the events at the bottom of the System logs page (orange frame).
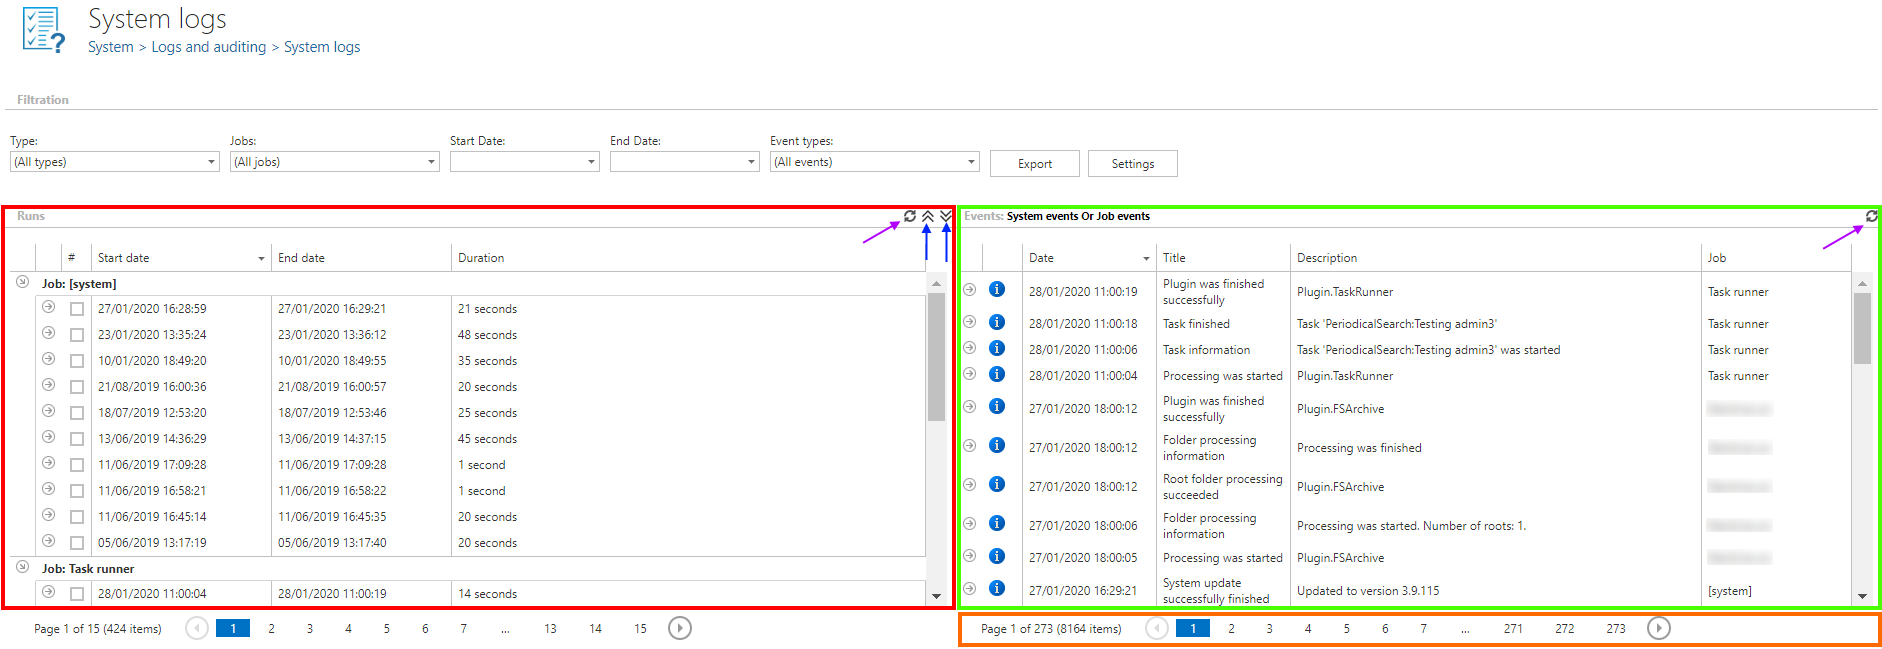
Sorting in System logs: sorting option is enabled both in the Runs and Events tables. Click on the particular column name (Start date, End date by the runs, Date, Title, Description, Job by the events), and the items will be displayed in the reverse order.

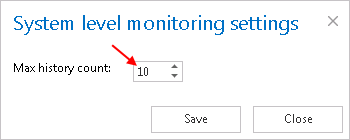
Setting of maximum history count of the runs: With this option it is possible to set, how many job runs the user would like to keep. If the value is set to 10 for example, and a job has run 20 times, then only the last 10 runs can be viewed, remaining 10 will be deleted and the user will not have an access to them. It is recommended to set a higher value here, if a job is running too often, or during the weekends, and the user needs to view the events retroactively.
This value is always inherited from the higher level. There are three levels altogether, where the history counter can be adjusted; the system is the highest level, the next is tenant level and the last one is the level of jobs.
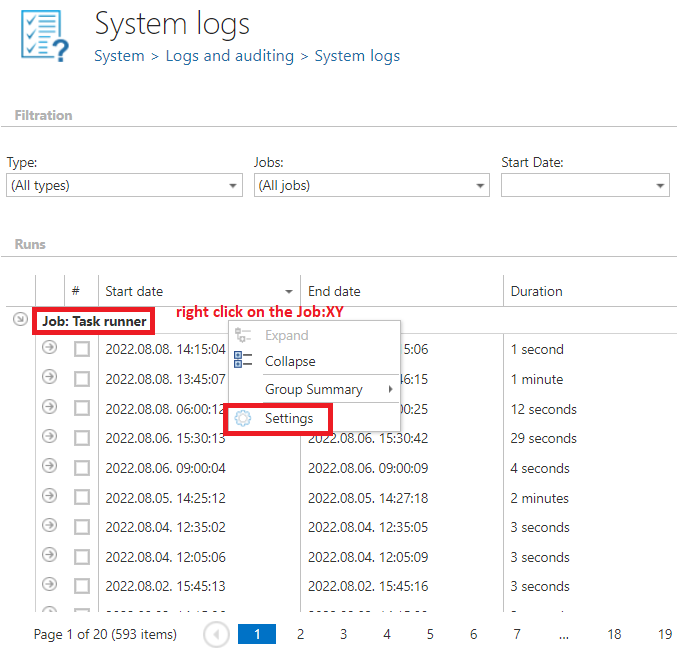
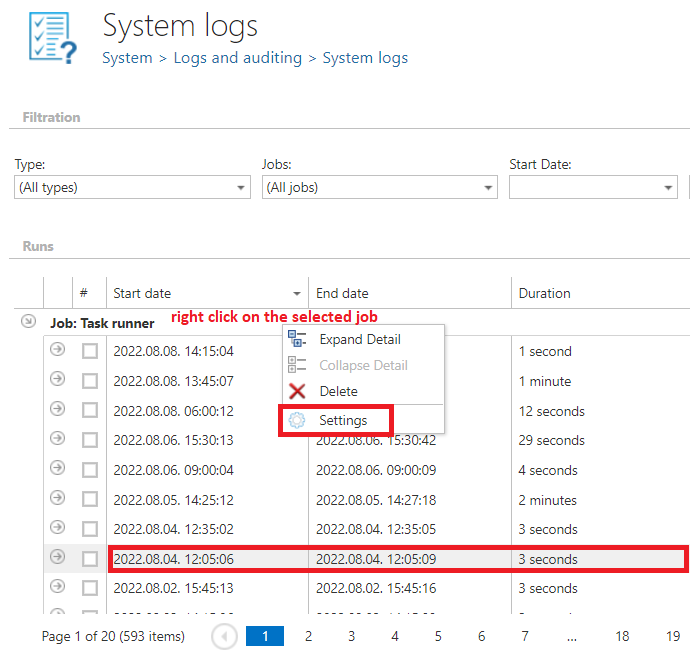
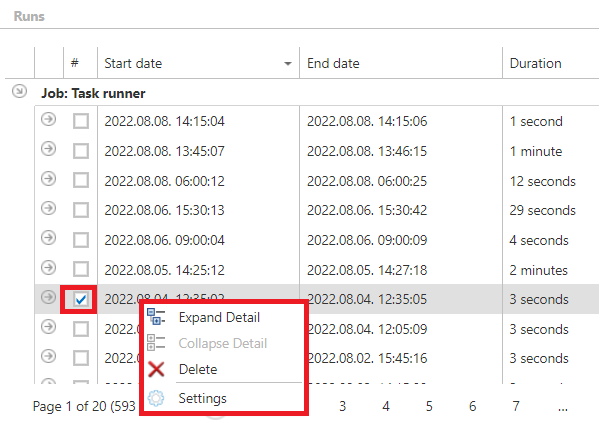
- System level settings are accessible with right mouse click on a system related job in the column of Runs; here click on Settings, and adjust these settings in the System level monitoring setting dialog.
- Tenant level monitoring settings are inherited from the system, i.e. if maximum history count is set on “10” on system level, then the same value will apply for the tenant level monitoring settings, too. Nevertheless it is possible to configure the tenant level settings independently from the system settings. Click on the Settings button and set the required value into the Tenant level monitoring settings dialog. If the tenant level settings are set independently, it can be still adjusted to the system settings with a click on the “inherit from system” option in the Tenant level monitoring settings dialog.

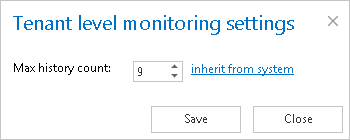
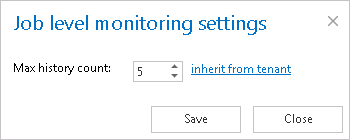
- Job level monitoring settings can be adjusted with clicking on the particular job running in the column of Runs and configuring these settings in the Job level monitoring setting dialog. These settings are inherited from the tenant by default. Nevertheless it is still possible to set another value with a right click on the particular job in the Runs column, select here Settings and set the maximum history count in the dialog. This value can be adjusted to the default value inherited from tenant with clicking on the “inherit from tenant” option in the same dialog.
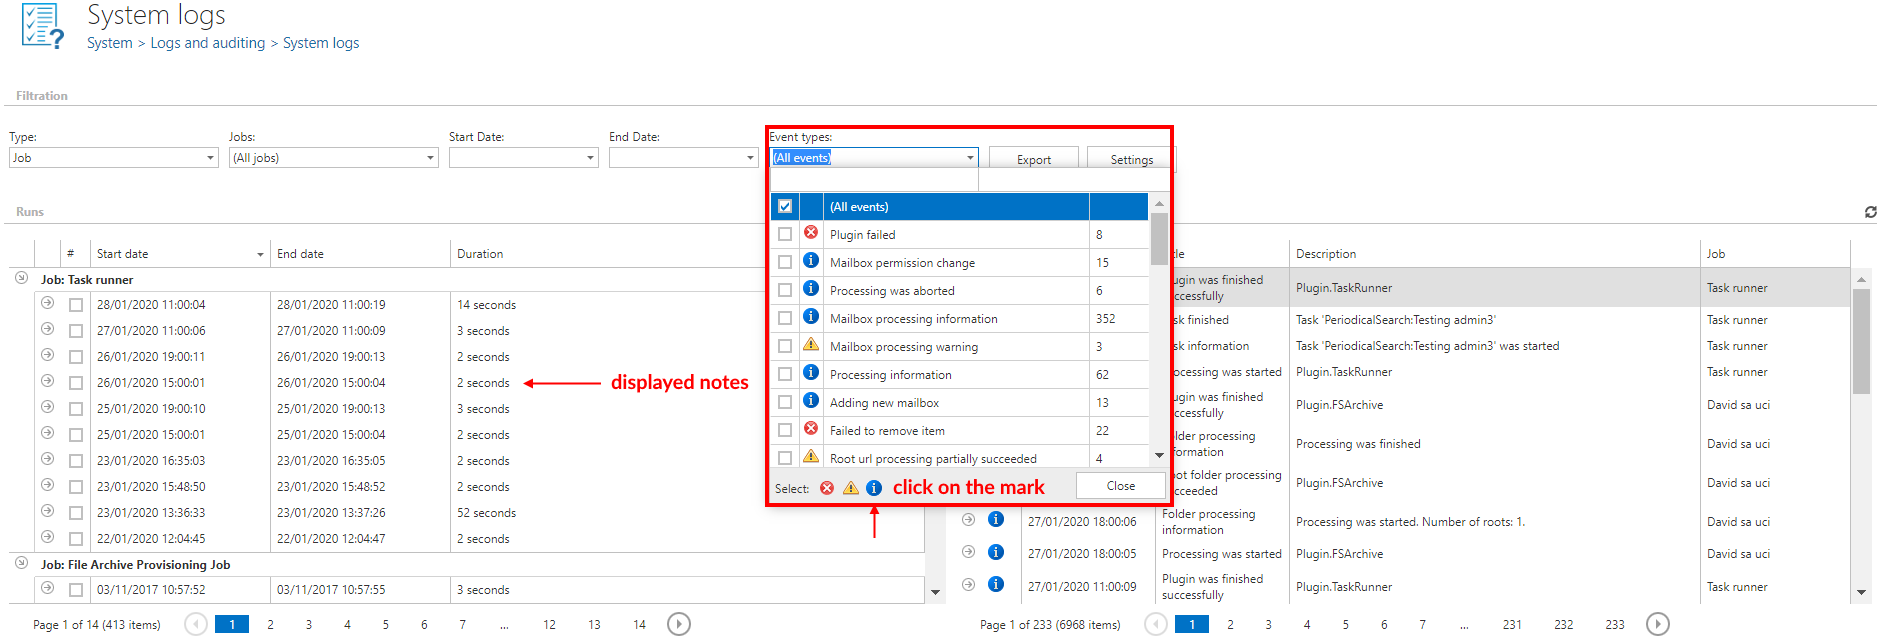
Filtration in System logs: If the user would like to check details of a certain system/job running, then he can also filter among the jobs under Filtration ⇒ Jobs: dropdown list. If it is necessary to check the system/job events that run in a certain period of time, then it is possible to further filter among these items with setting the Start date and the End date under filtering options. Under Event types it is allowed to filter among event types occurred in the actually selected events. An event type filter is also available at the bottom of the Event types dropdown list. Using this filter it is possible to sort out all events which belong to one of the 3 event groups [1. error ( ), 2. warning (
 ) or 3. note (
 ]. Click on the mark of the particular event group next to “Select”, and the selected events will be displayed. On screenshot below, we sorted out all the notes (with a click on “
 ” mark).
The Export function makes it easy to save the reviewed events into XML, CVS or HTML. The report contains all necessary information (date, job ID, Message, Details) which enable to have a look at the desired information, and also identify possible failures very quickly. This enables a very quick access to the system/job processing information and also ensures a very quick troubleshooting in case of need.

On the below displayed screenshot we have filtered out Mailbox Provisioning Job and TA_ Email Archive job and set 1st of July 2015 as Start date, and 8th of July as End date. Among event types we have also set All events. This filter will find all the events related to these 2 jobs, which happened in this time interval.
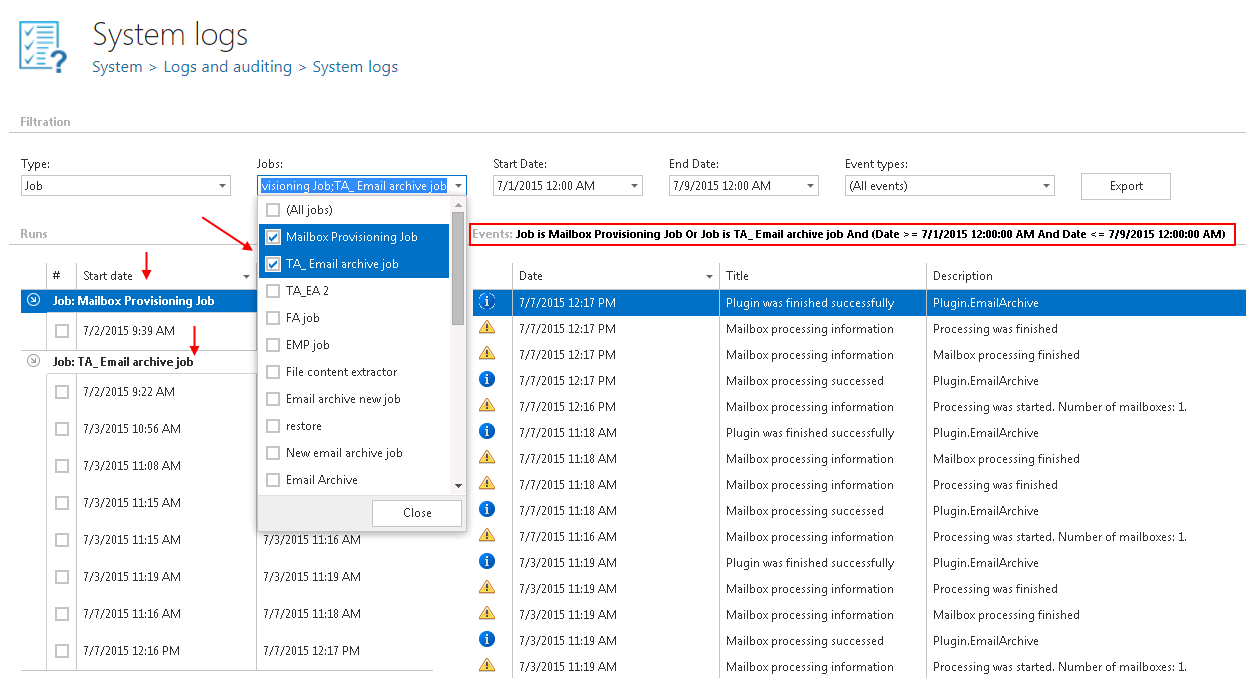
Under Runs section click on the arrow mark next to the job and the last run times will be opened. In the table of Events at the right side of the screenshot you can see all the events related to these 2 jobs, in time period 1st of July – 8th of July. With a click on the certain run of the job instance (for example with a click on the Mailbox Provisioning job that run at 7/2/2015 at 9:39-9:40) you can open further details about this run. In our case we can see that Mailbox provisioning job has processed in this time 98 mailboxes, of which 25 mailboxes added, 71 mailboxes skipped, 2 mailboxes updated etc. red arrows).
If you check the checkbox next to this run of the job, then the right hand table will display all events, all event types related to this run at 9:39-9:40, on 2nd of July.

Now, if you want to visualize only information about Plugin was finished successfully type of event, then set this filter in the Event types checkbox. As result, only this type of event will be displayed in the table of Events.

With the Export function you can save this report in one of the file types, for example in HTML:

The report will contain all necessary information that might be very useful for a user to identify any failure, or just check the last event(s) of this job at the time period that was filtered out.

How to manually remove system/job runs and system/job related events from System logs:
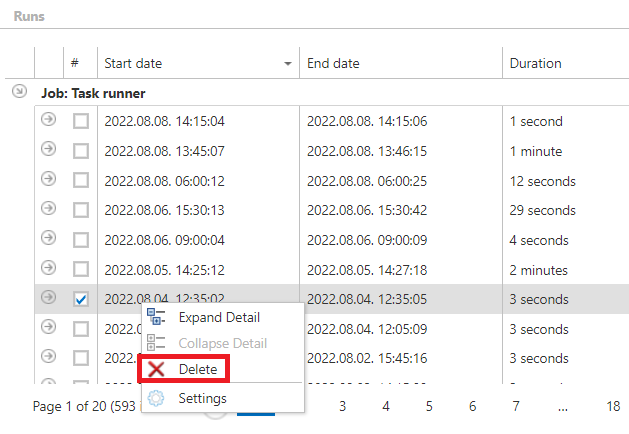
- To delete system/job runs right click on the particular system/job run in column Runs and select Delete from the context menu (Screenshot A).
- To delete a particular event right click on the particular event and select Delete from the context menu (Screenshot B)
