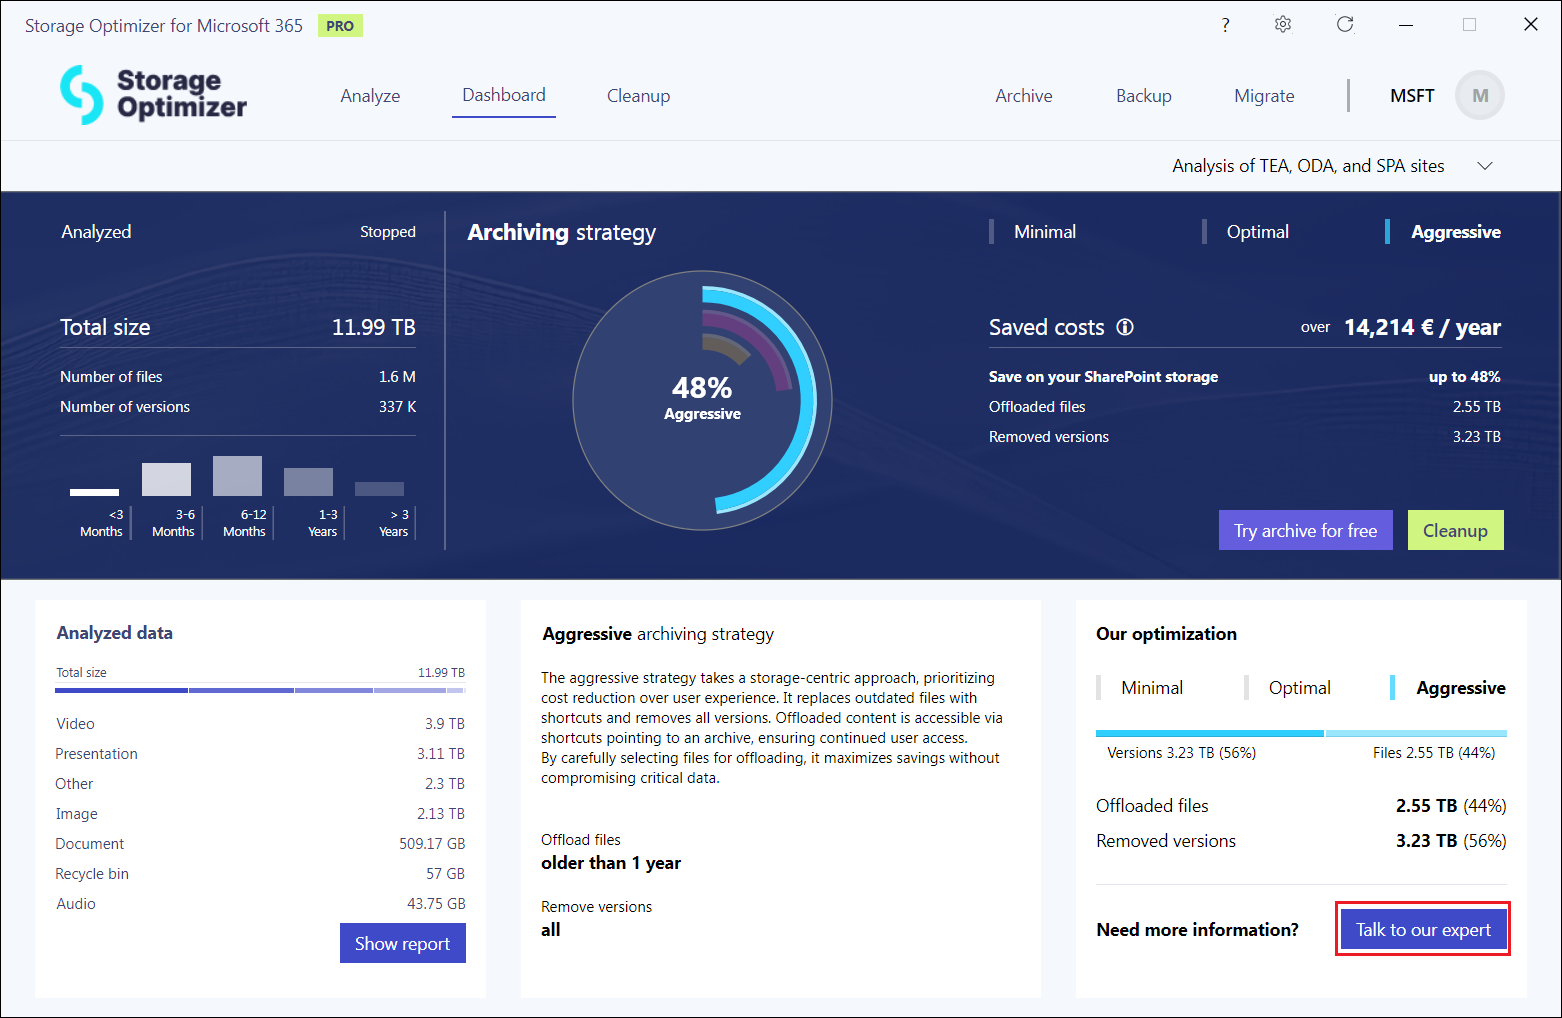
5.2.Dashboard
This page provides a summary of storage usage, suggests an archiving strategy to save space, and offers options for
further actions. Here, you can see the analyzed data in a visual representation and follow the progress of the analysis. By default, the page shows the latest statistics for the analyzed data, however, it is also possible to switch between the scopes.
The scope is a logical group of site collections selected for the analysis, their data (files, version counts, size) is summarized during the analysis. A scope can contain site collections from whatever group selected on the Analyze page from the list.
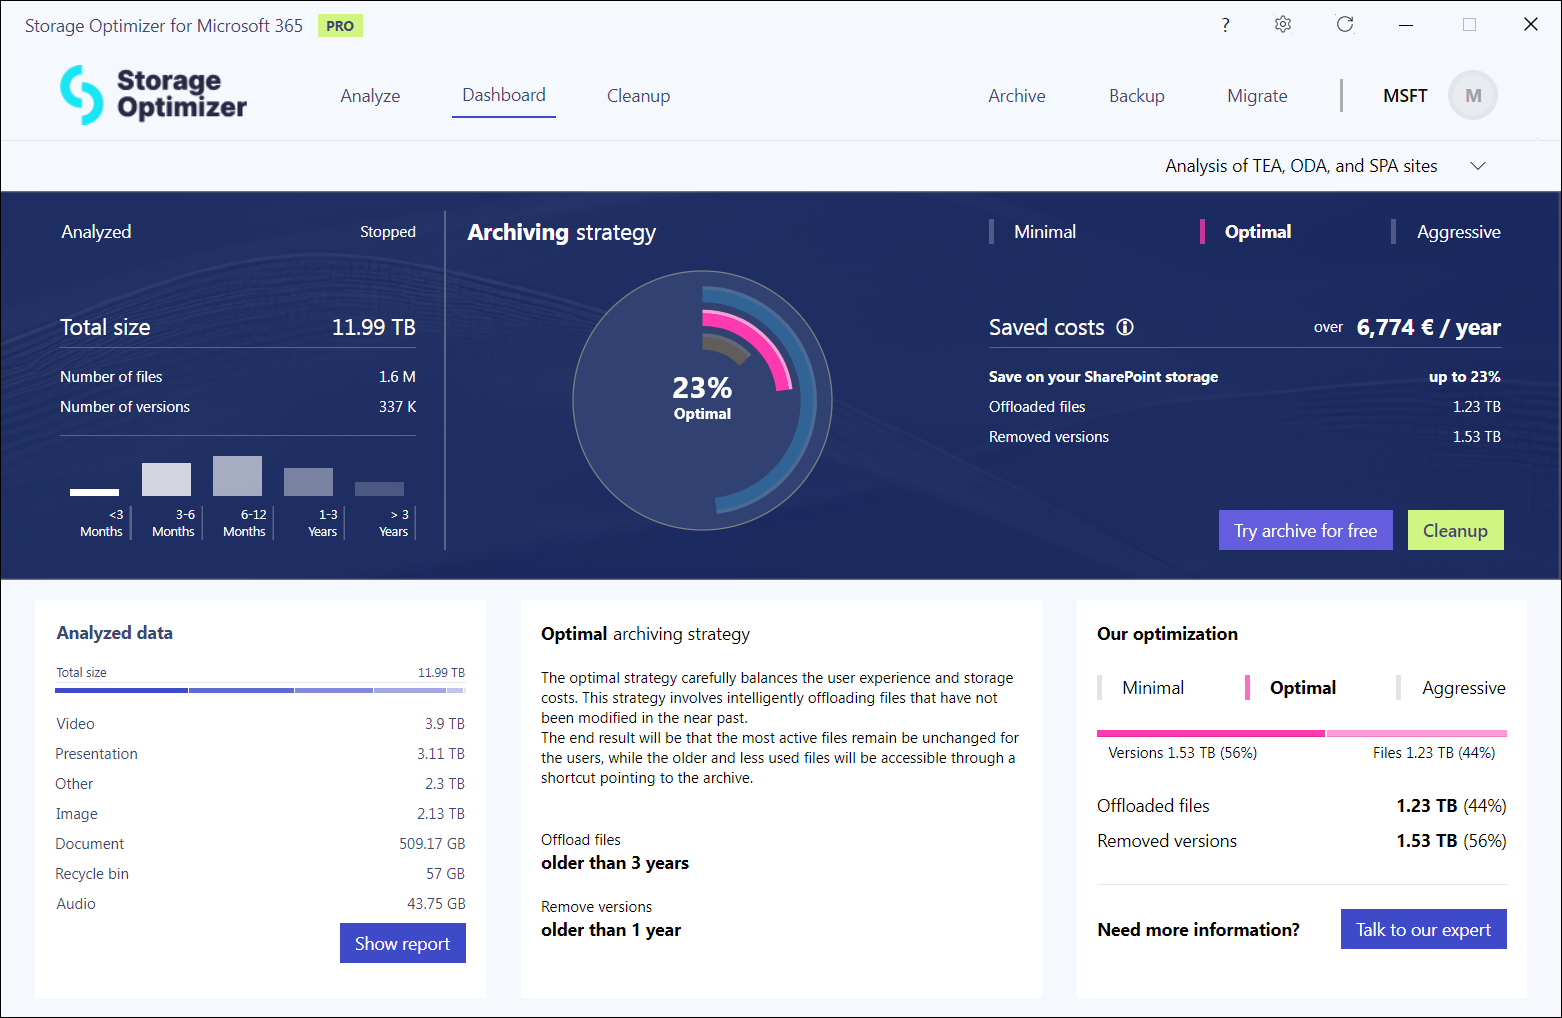
All previously configured (and active) scopes are available from the dropdown menu on the right side of the page. From here, you can restart or stop the analysis, change or delete the scope.
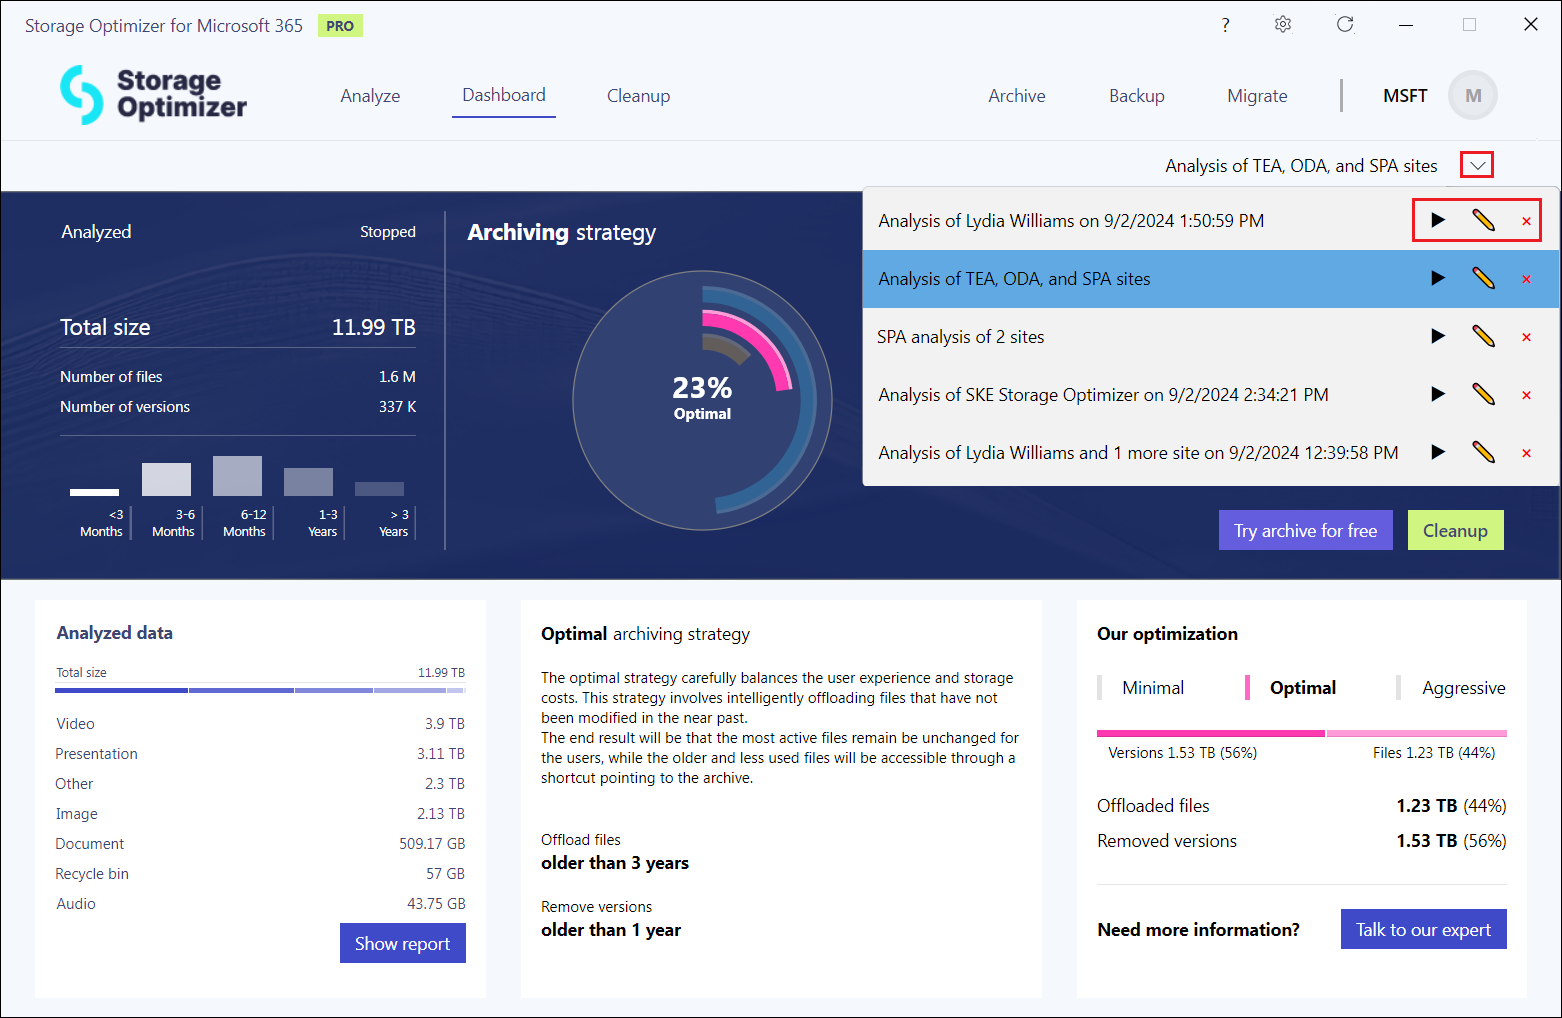
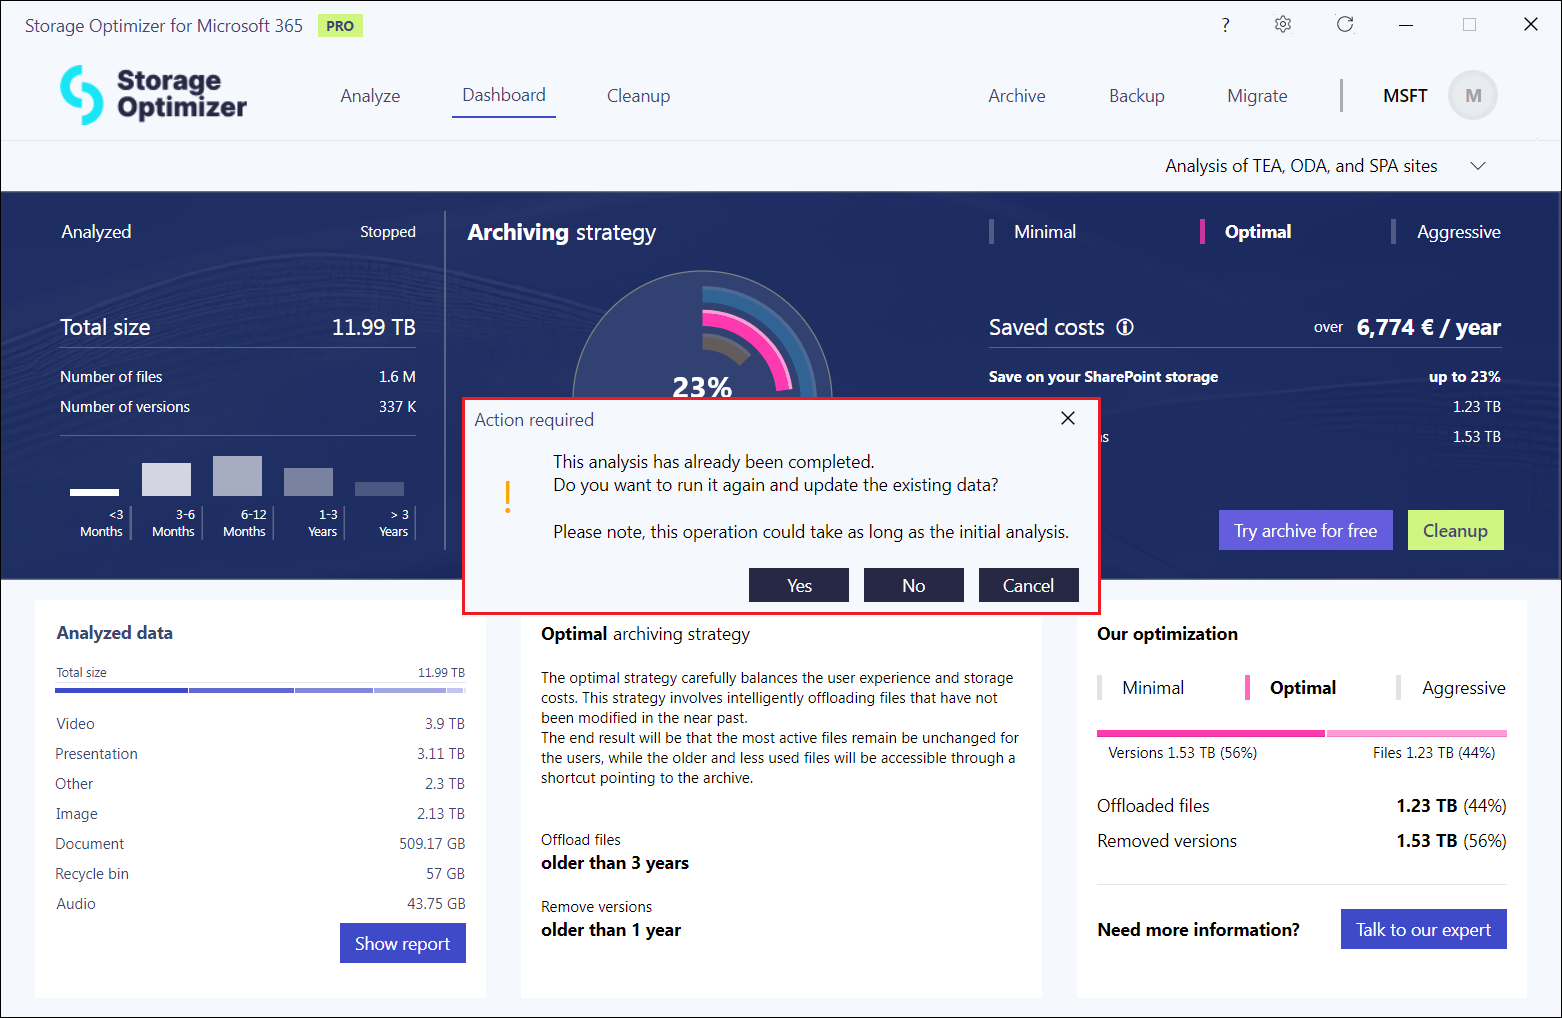
If you wish to restart a previously completed analysis without making any changes to the scope, simply press the start button. A pop-up window will appear, asking if you want to update the existing data. By clicking ‘Yes,’ you allow the analysis to re-process and update the data.
The Dashboard page includes the following sections:
- Analyzed Data
- Archiving strategy
- Optimization
1. Analyzed Data
In this section, you can see the summary of the analyzed data from the selected scope. This section provides you the following information:
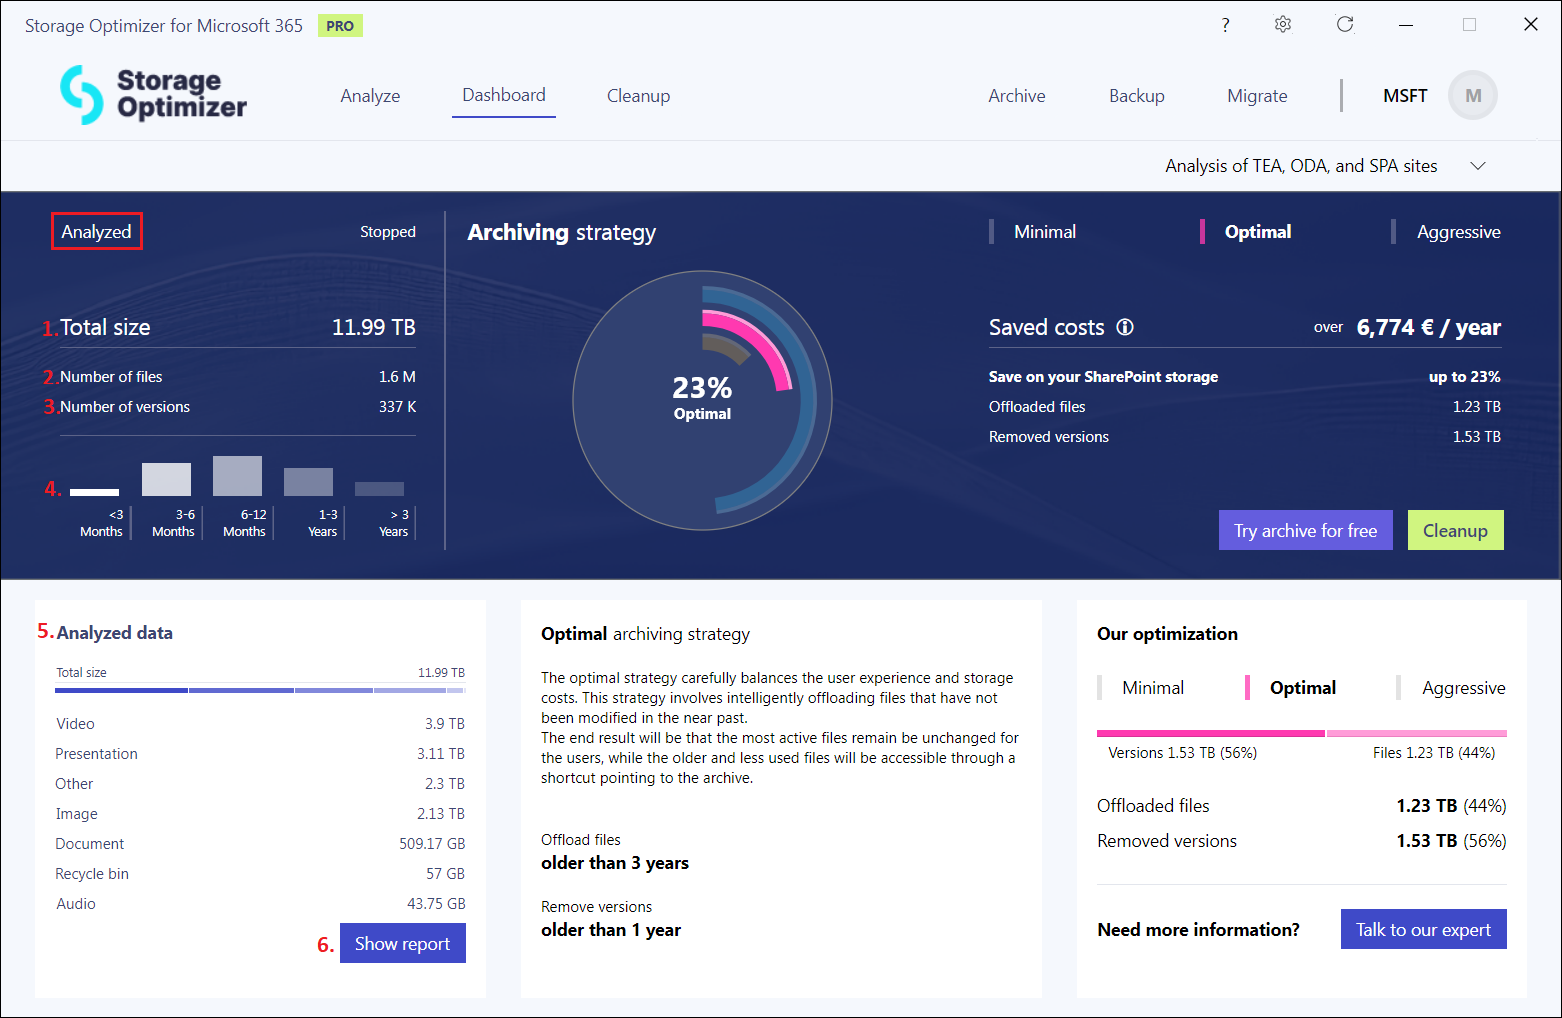
- Total size – how much data you have in the analyzed site collection
- Number of files – how many files you have in the analyzed scope
- Number of versions – how many versions are in the selected site collection
- Time chart – it shows the distribution of files in time. The data is grouped by the time intervals based on the last modification date:
- files younger than 3 months
- files modified between the last 3 to 6 months
- items modified in the last 6-12 months
- items modified between the last 1 to 3 years
- files older than 3 years
- Analyzed data – a detailed chart of the analyzed data, grouped by the categories: images, documents, videos, presentations, recycle bin, etc. This section changes depending on what files you have in the analyzed site collection.
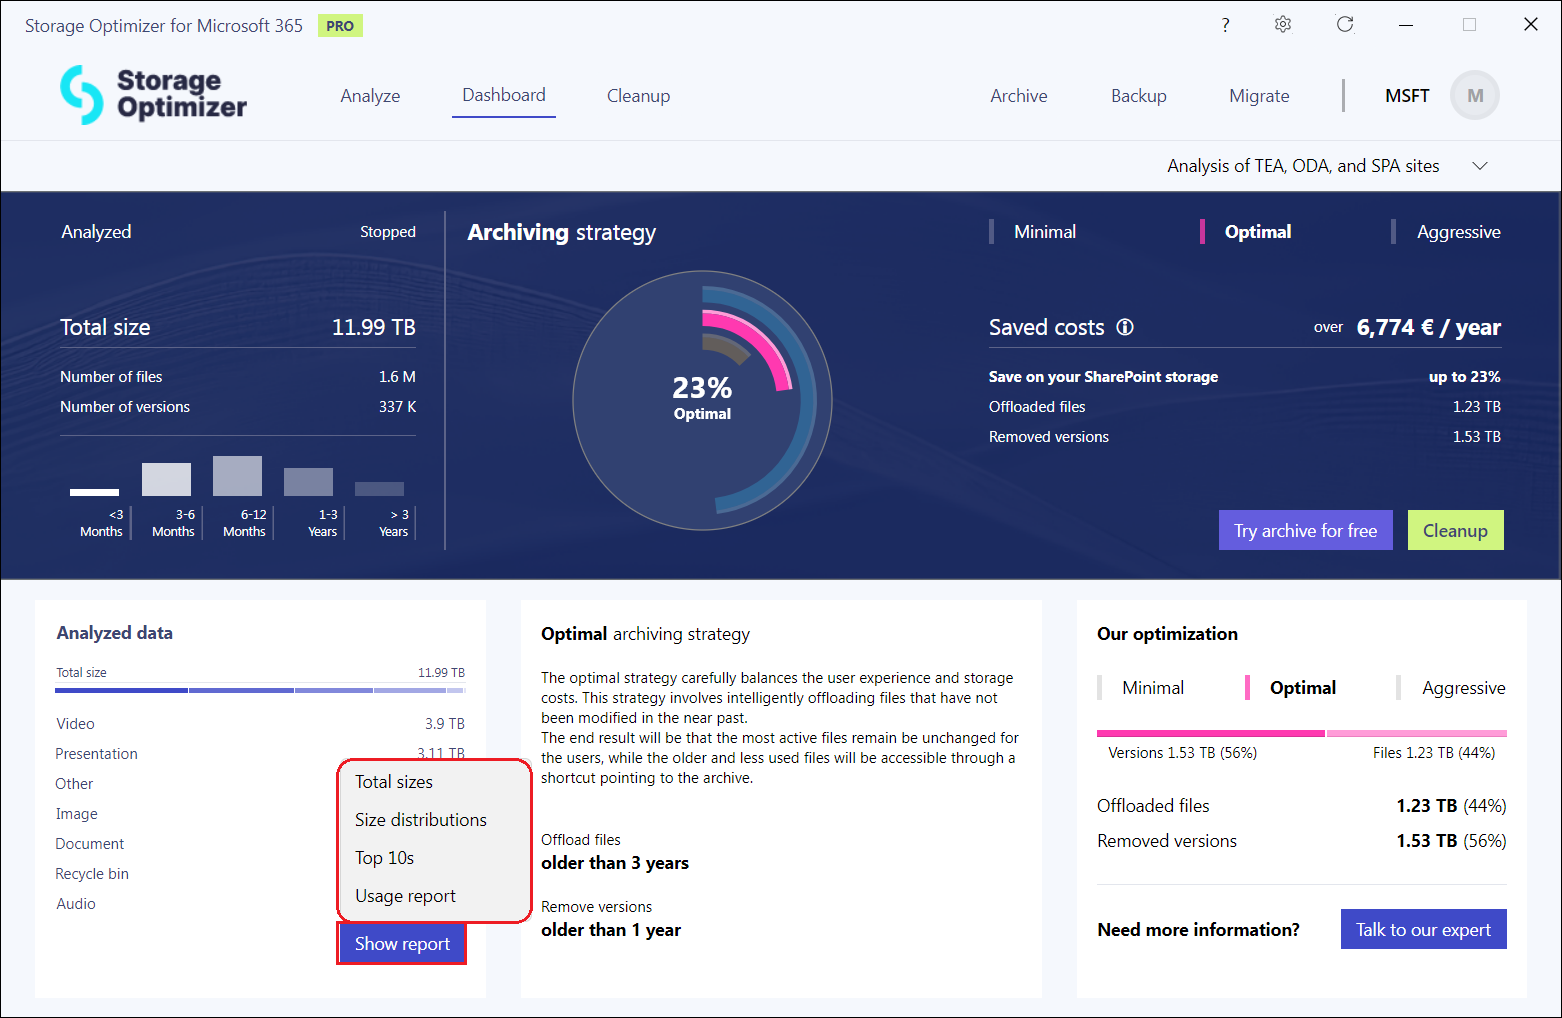
- Show report button – you can view detailed reports by pressing this button. Currently, 4 types of report is available in the menu:
- Total sizes – this report summarizes the total number of files and their versions, shows how much storage space can be freed up by using an archiving solution, and provides insights into the types of data and documents stored in SP
- Size distributions – shows the size distribution of your data across SP sites, Teams, and OneDrive, or how
much storage is used by document versions automatically saved by SP during editing - Top 10s – this report highlights the largest SP sites, shows the size ratio of the largest SP sites, and identify large files that may be causing storage issues
- Usage report – highlights the number of inactive sites, shows document libraries where a large number of files are concentrated, pointing to potential structural issues in SP, or provides insights into how your data volume in SP has grown over time, an it can help you plan your storage needs and budget more effectively
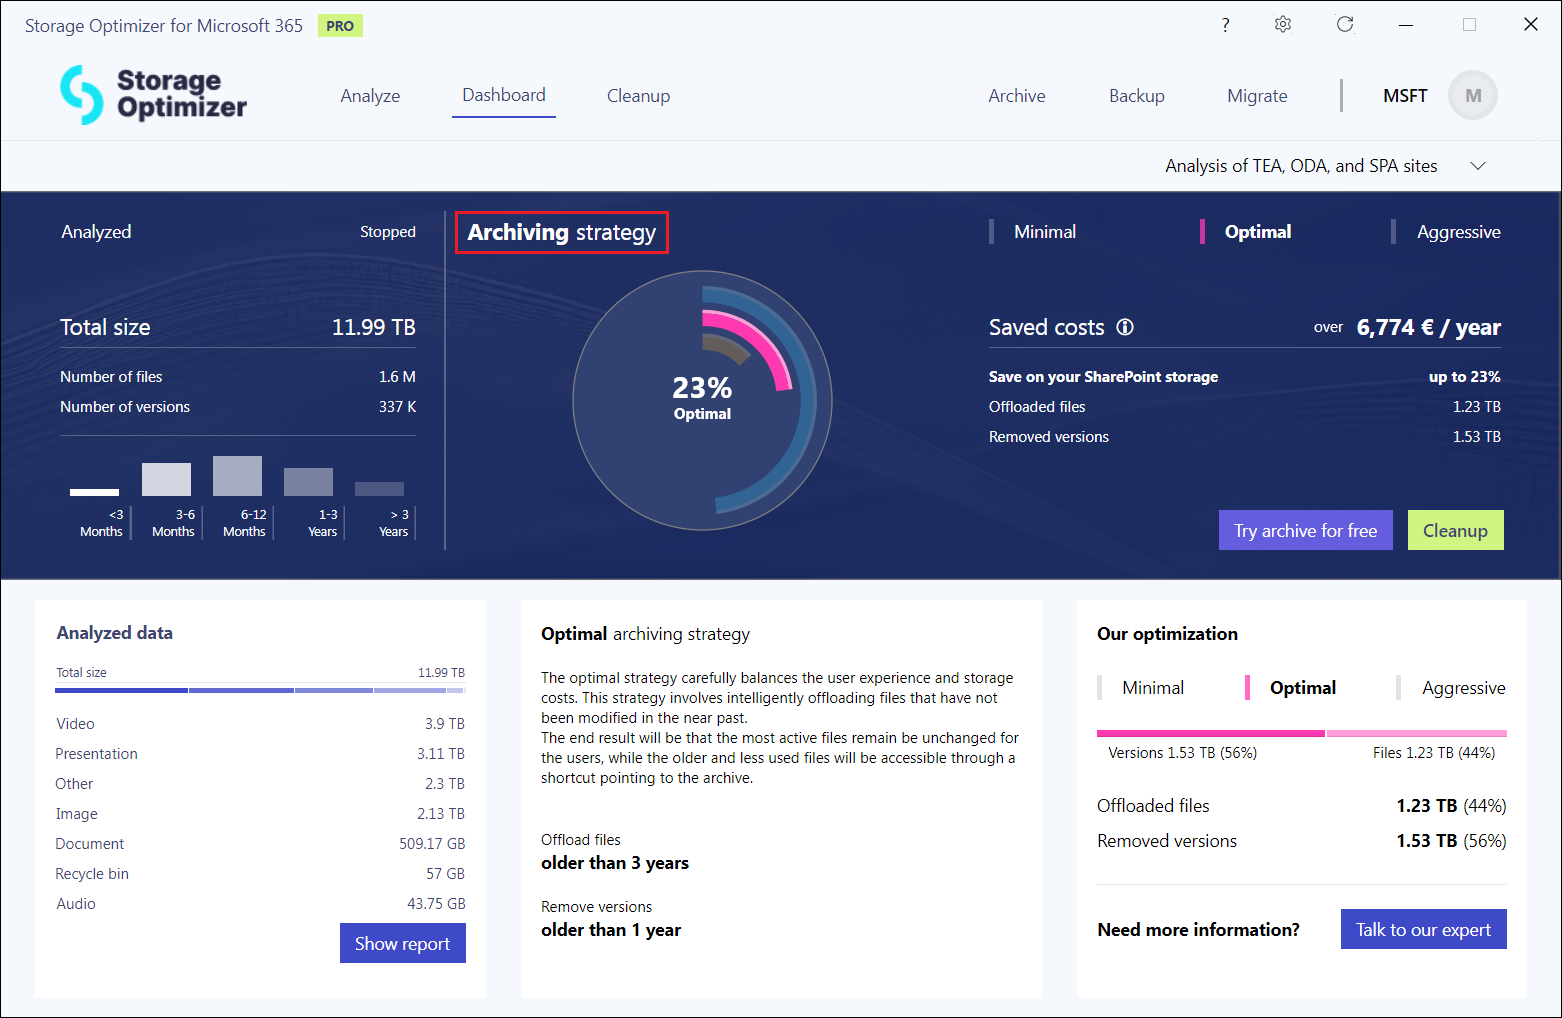
2. Archiving strategy
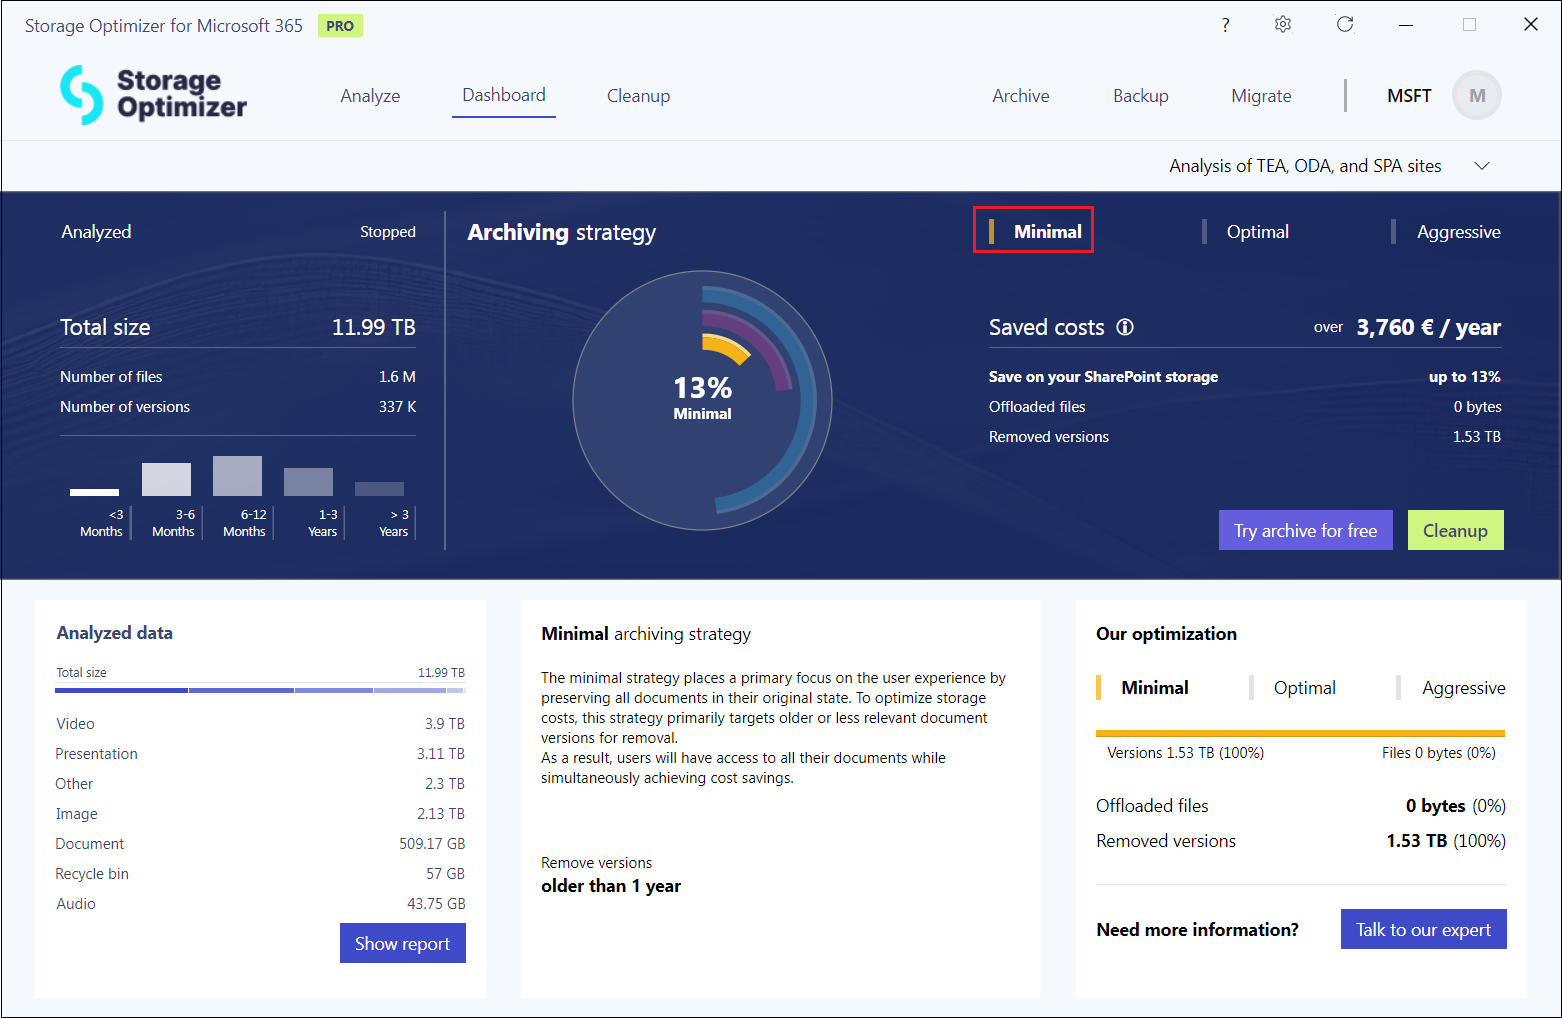
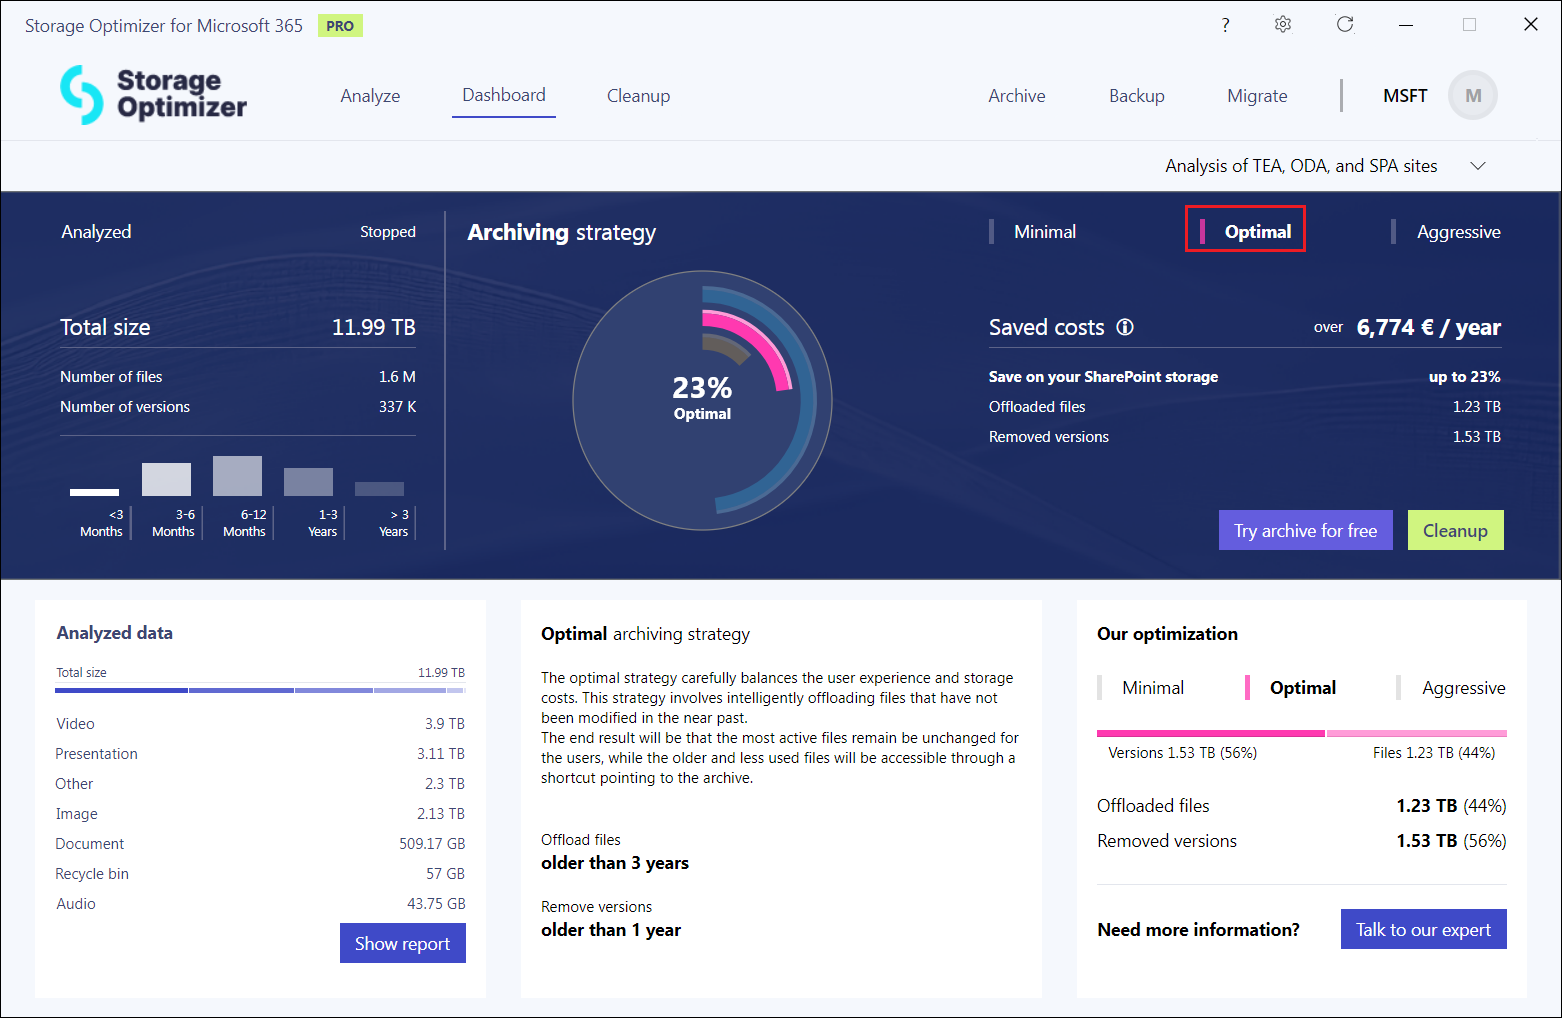
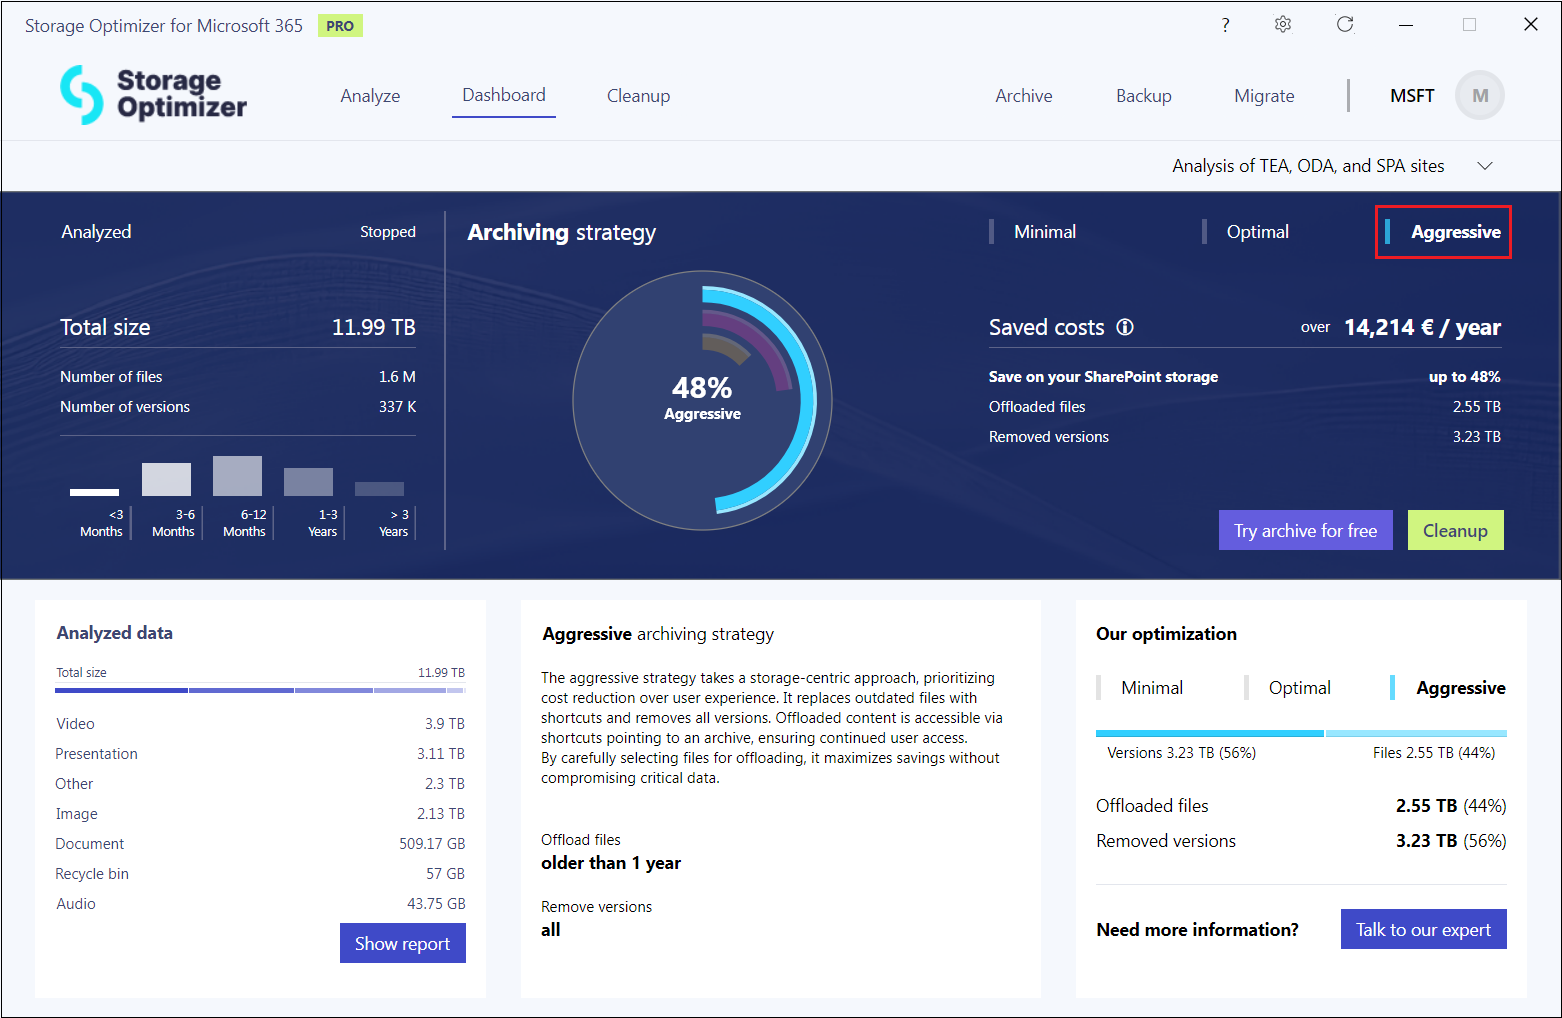
In this column, the archiving strategies are described, and the SharePoint storage saving is shown in a chart. The description varies depending on which optimization is selected: Minimal, Optimal, and Aggressive, our your custom analysis strategies. Also, the graph illustrates the percentage of SharePoint storage saving with different colors.
3. Optimization
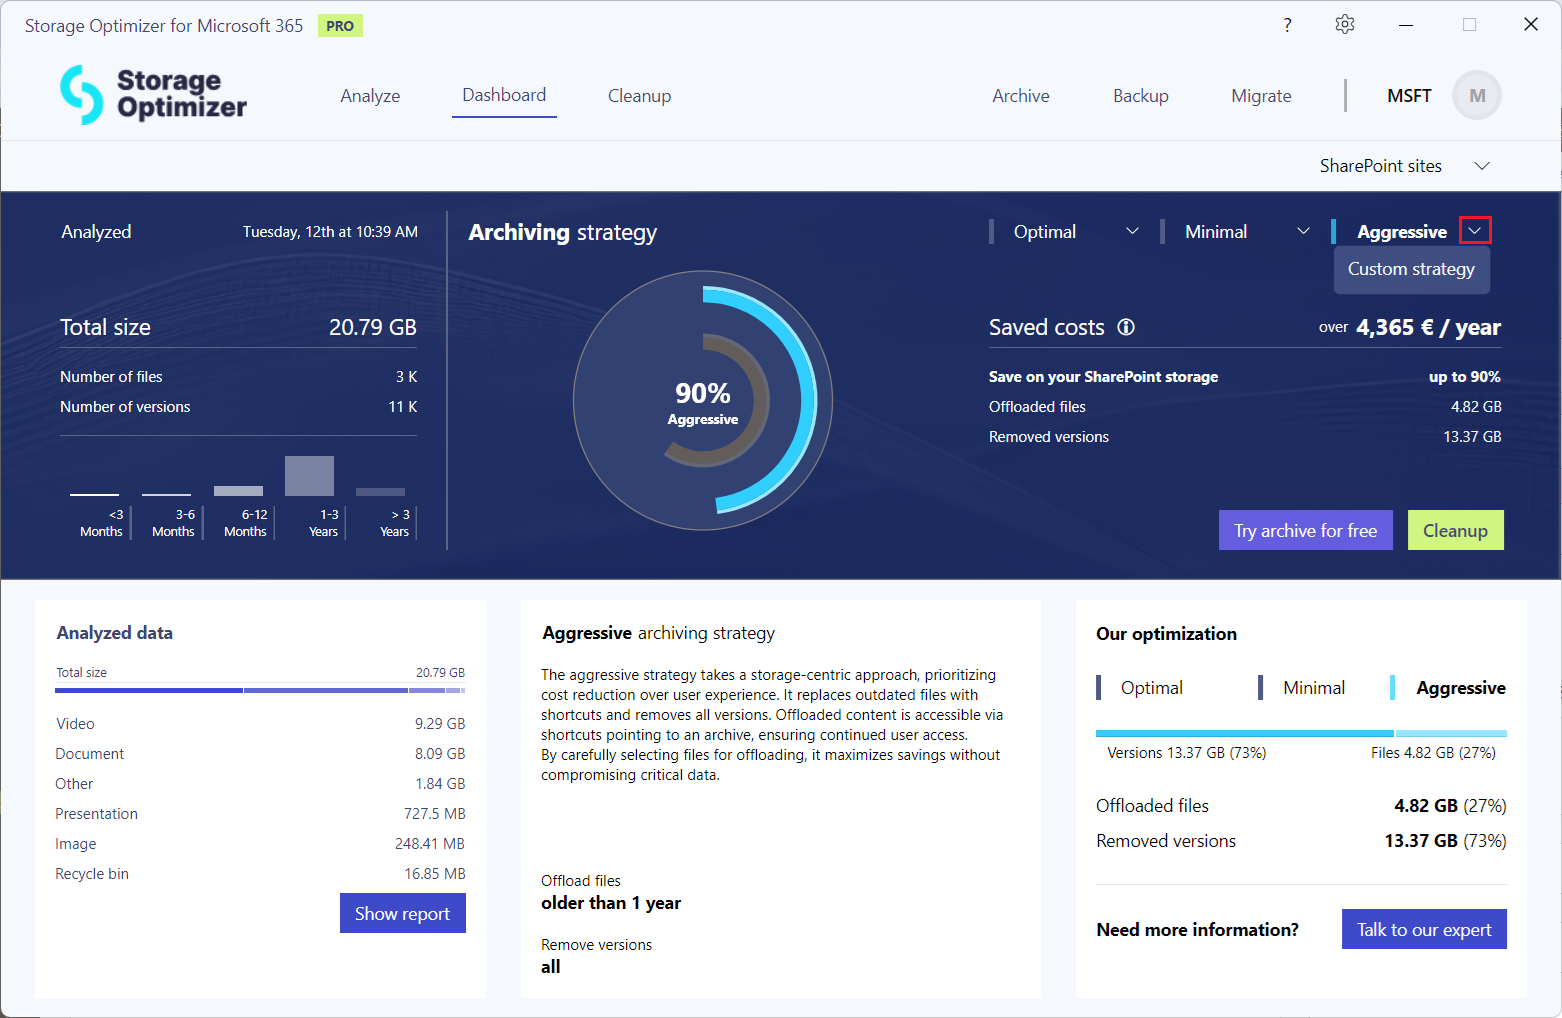
Here you can see how much money (saved costs/year) you could spare using the different archiving strategies. By default, Storage Optimizer shows only the three predefined strategies: Minimal, Optimal, and Aggressive. However, you can also define custom analysis strategies directly in the application, allowing more flexibility to tailor the analysis to specific needs. These custom analysis strategies can be created and editing on the Settings page.
After creating custom strategies, use the down-pointing arrow next to the default options to view them. The displayed counts will change based on the selected settings.
1. Minimal
In this strategy, the primary focus is on the user experience by preserving all documents in their original state. To optimize storage costs, this strategy mainly targets older or less relevant document versions for removal.
As a result, users will have access to all their documents while simultaneously achieving cost savings.
In the case of this strategy, only the versions older than 1 year will be removed. The files themselves won’t be touched. The optimization will display the offloaded files and removed versions in bytes and percentages.
2. Optimal
This archiving strategy balances the user experience and storage costs. It involves offloading files that have not been modified in the last 3 years and removing the versions older than 1 year.
This means that the most active files will be unchanged for the users, while the older and less used files will be accessible through a shortcut pointing to the archive. The tool will show the offloaded files and removed versions in bytes and percentages on the right side of the page.
3. Aggressive
The aggressive strategy takes a storage centric approach, prioritizing cost reduction over user experience. It replaces outdated files (files older than 1 year) with shortcuts and removes all versions. The offloaded content is accessible via shortcuts pointing to an archive (SharePoint, OneDrive, or Teams archive).
The optimization will display the offloaded files and removed versions in bytes and percentage on the Dashboard tab.
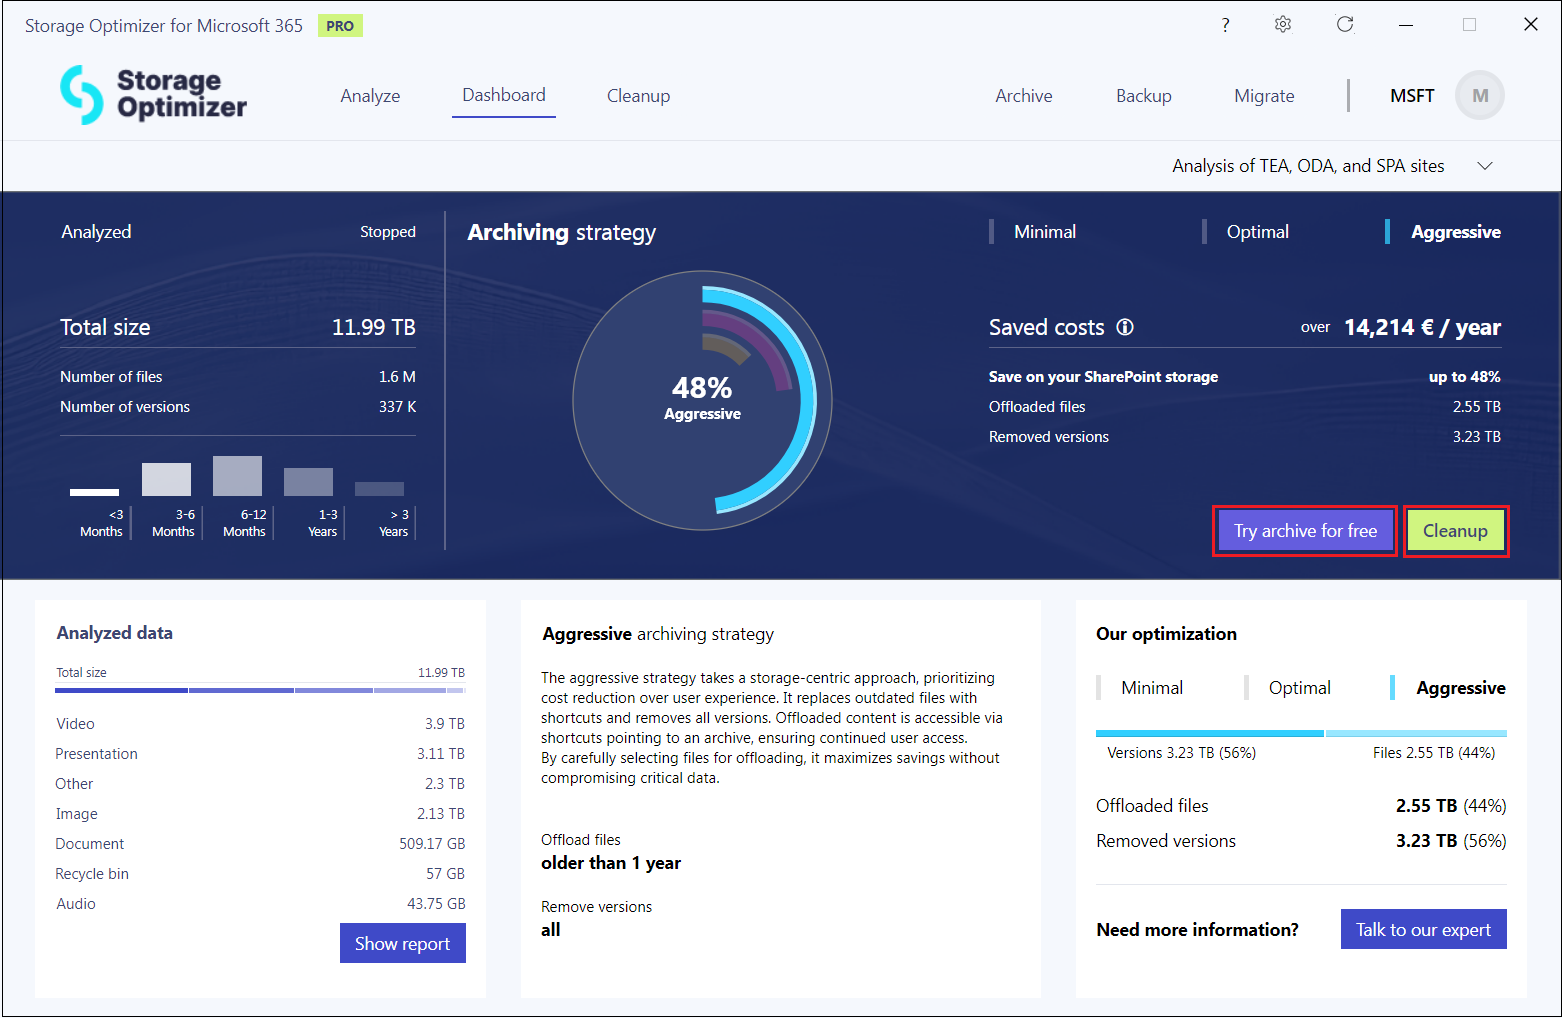
You can also request to test the archiving feature by pressing the Try archive for free button, which opens a Trial request pop-up page in the application, or start the cleanup process by pressing the Cleanup button. It will lead you to the Cleanup page if your license allows it.
The last component of the page is the Talk to our expert button, which gives you the opportunity to share your comments and opinions with us. After pressing the button, the window is automatically filled with some basic information about your Storage Optimizer. You only need to add your name, email address, and your personal message.
